A Strong Rally Hit Resistance—Here’s What the Market Is Really Telling Us
As the S&P stalls at key resistance and Transports hit new highs, market internals reveal why a pause—or pullback—may actually set up the next move higher.
You've reached your free article limit
You've read 0 of 1 free Pro articles.
 NYSE Trader
Let’s get the complaints out of the way first.
Let me start with the fact that penny stock trading is back. It’s been missing for months but this week it reared its head again. The easiest way to tell is to look at the volume on Nasdaq. When it tops ten billion shares a day, it’s time to check in on the penny stocks. Five penny stocks were approximately 20% of the volume on Nasdaq Wednesday.
Over on the NYSE, the upside volume clocked in at 73%. For a day that the S&P was up more than two percent, that’s not impressive. I know some will highlight that energy stocks were down. But that’s rationalizing an indicator, something I do not like to do.
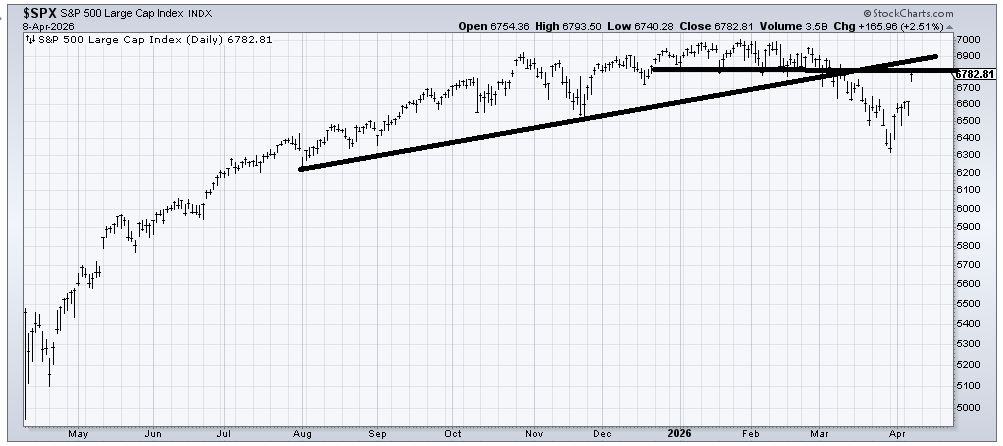
I know there will be many who will note that the S&P stopped right at 6800, which has been resistance (prior support becomes resistance). I almost always care more about the indicators than the resistance or support on an index chart, so let’s put the fact that it stopped at resistance in the ‘noteworthy’ category.
It was also the sixth straight up day for the major indexes. That’s a long streak and often not sustainable. In fact, the longer the streak goes on, the worse it is. Better to have a down day to break things up, gather some more shorts.
Now, for what was a highlight. The Transports made a new all-time high. About 2 or 3 weeks ago, I noted that despite the rise in oil, the Transports were hanging in there and well off their lows. Now they have gone on to make a new high. I’ll just say that’s bullish for the Transports.
If you are a Dow Theorist, then for the time being, we have a Dow Theory non-confirmation because the Industrials are not at a new high. They would need to trade back over 50,000 for that.
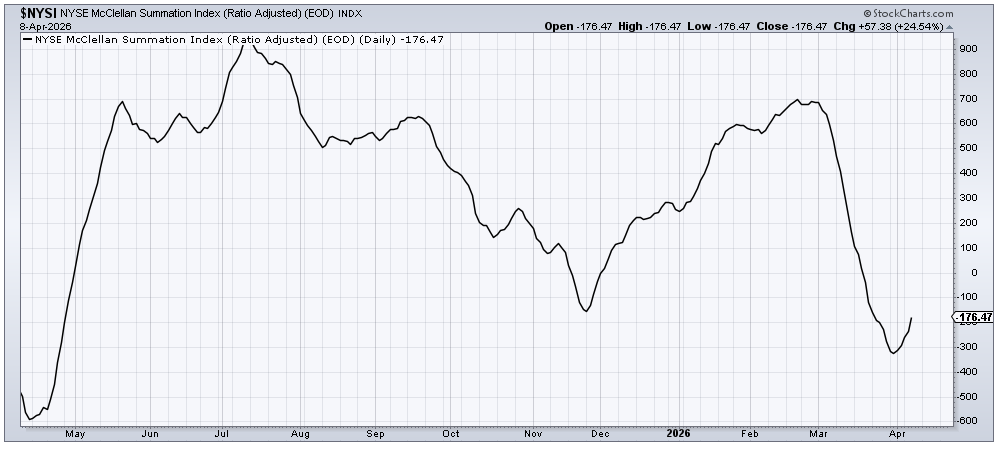
Yet the McClellan Summation Index is still rising. It even has a decent cushion of -2800, meaning the market can back off, and as long as the advance/decline line is not worse than -2800, the indicator will keep on rising.
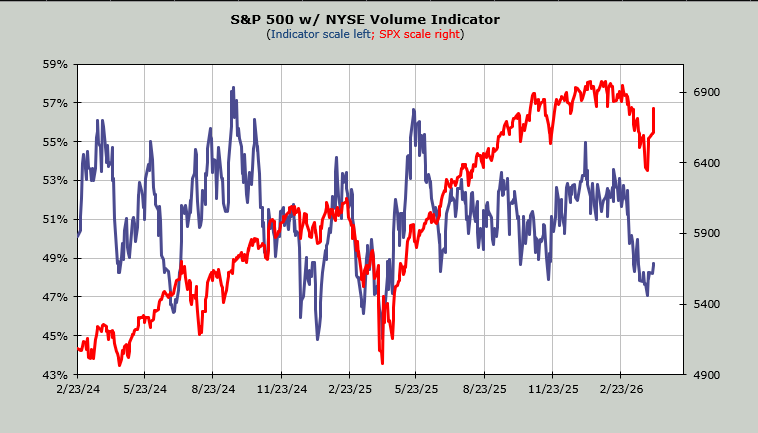
The Volume Indicator, which tagged 47% (oversold) last week, is lifting off that level, with it now standing at 48%.
Sentiment-wise, the put/call ratio remains elevated, as it clocked in at .98 on Wednesday. The ISEE Call/Put ratio was fractionally under 1.0 at .99 so there was not any sign of excess call buying.
Finally, the market seems to have, in terms of groups, picked up where it left off in February, before the war began. Energy stocks gapped down but closed near the high of the day. Software stocks gapped up but closed near the low of the day.
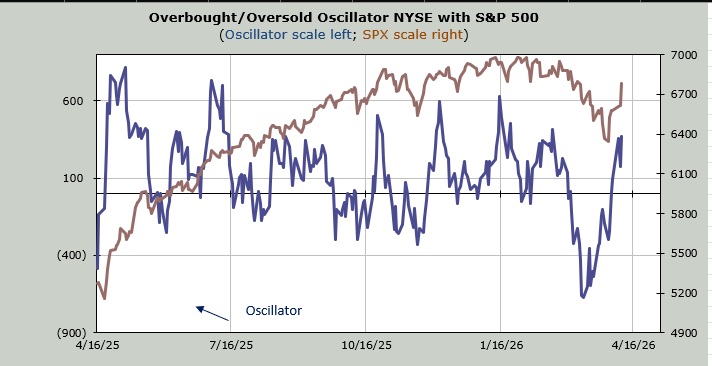
My own Overbought/Oversold Oscillator is getting overbought, but I still think a down day or two would give us another rally into a proper short-term overbought condition. If the S&P is still under 6800 by then, I’ll fuss more.