A Rally This Week Would Make Folks Bullish on This One Key Group of Stocks
Last week was choppy, but a strong market this week will get investors excited about this group again.
You've reached your free article limit
You've read 0 of 1 free Pro articles.
You do realize that the majority of stocks did a lot of chopping about last week, don’t you? If it wasn’t for the index movers/growth names, you’d have thought last week was all about nothing.
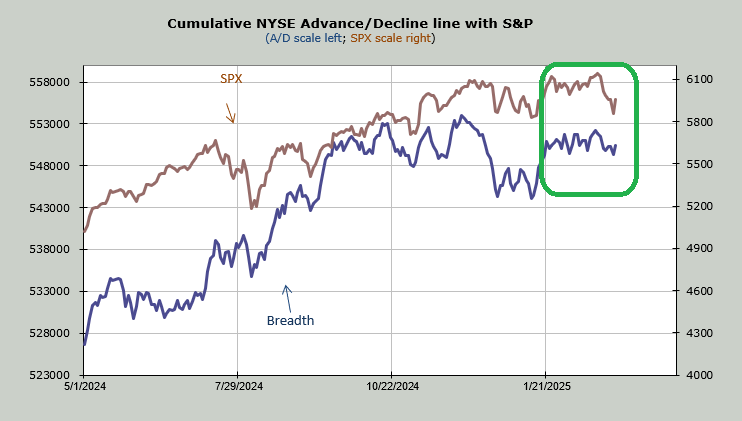
Take a look at the chart of breadth (blue) with the S&P (brown). The S&P plunged under the lows it had been holding (but did not break that mid-January low, unlike Nasdaq and the IWM, which did). But look at breadth: it just merrily chopped about. Breadth was not terrible last week.
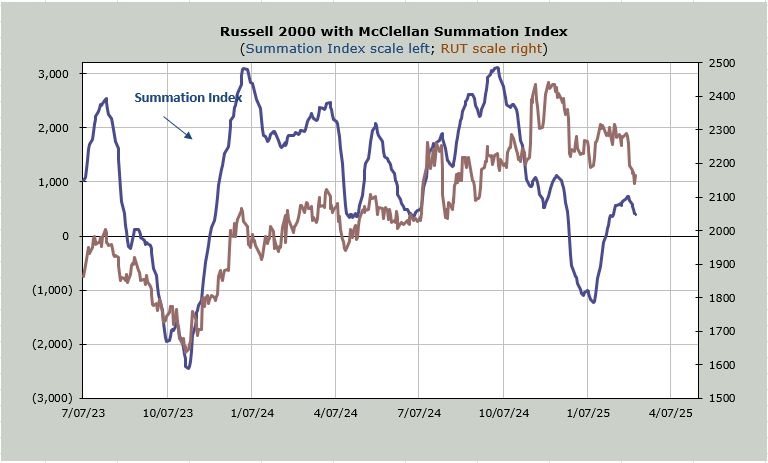
Or let’s take a look at the McClellan Summation Index. Do you see how the Summation Index tends to lead the Russell 2000 lower? They often just move hand in hand, but rarely does the Russell plunge while the Summation Index yawns. I have noted this before last week, but let’s explore it again. That turn-down in the Summation Index (blue) looks nothing like that plunge to a lower low in the Russell (brown). We often see it the other way around, where we get a big move down in the Summation but not a commensurate move in the small caps, but this time that wasn’t the case.
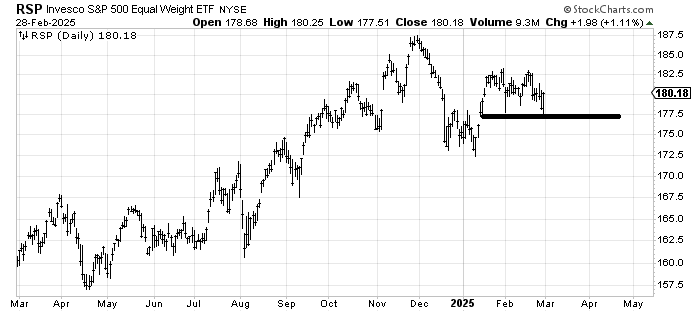
Let’s check in on RSP, an equal weight S&P ETF which diverged a bit from IWM last week. You can see RSP, like breadth, did not break those lows that have been holding for the last six weeks (chop!).
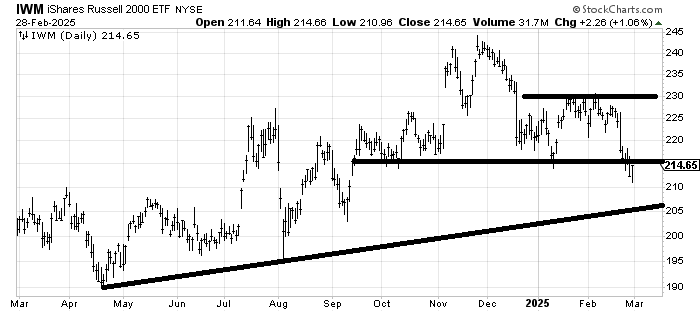
IWM, everyone’s favorite go-to for ‘breadth’, did manage not only to break the lows of the last six weeks, but it also managed to break under 215, which had been holding since October.
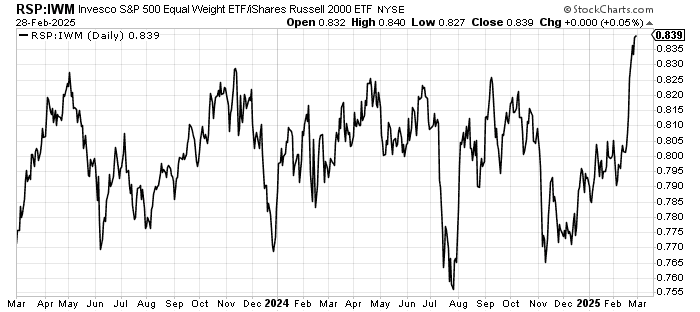
Naturally, this caused me to look at the ratio of RSP to IWM, and I discovered quite a breakout. This is a 2-year chart, but I could have shown you a five-year chart; it would look the same.
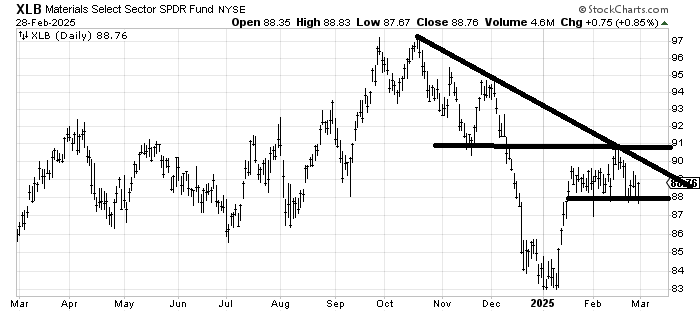
We see the result of this action by noting that the majority of stocks chopped last week. Heck the Dow Jones Industrials were up 400 points on the week and mostly went sideways. So did the Transports. So did the Industrials (XLI). The Materials ETF (XLB) has been going sideways for six weeks.
So, last week was about taking the growth names down. Oh, don’t get me wrong, there were growth names that held up—did anyone notice that Costco was barely down? But my point is that when it comes to sentiment, the euphoria was in growth, and last week took that down a notch.
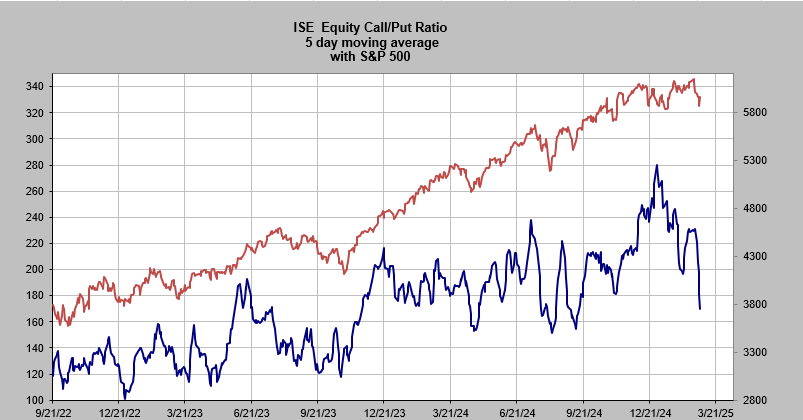
I see it best in the five-day moving average of the ISE Equity call/put ratio. We looked at this last week as it was coming down, and now it is closing in on where it was in August. Mind you, the 21-day moving average has barely budged as it will take more than a few days to push that away from complacency, but we can see the change in sentiment on this much shorter-term chart.
I fully expect that should we get a short-term oversold rally this week (my assumption), folks will get bullish on growth stocks again in a hurry. But we have to see if that move in the RSP:IWM ratio gives it back or if it can hold its own.