A Decline in Gold Gives Other Stocks the Chance to Rally, But Is There a Change?
Will gold break its up trend? Are stocks ready to decline? What's next?
You've reached your free article limit
You've read 0 of 1 free Pro articles.
Quantum, Gold, Uranium, and Rare Earths, Oh My!
At some point, parabolas stop going up, and they come down. Often by a lot. The past few days have been a lesson in what happens when the air leaks out of a speculative bubble. And the lessons, I believe, will continue.
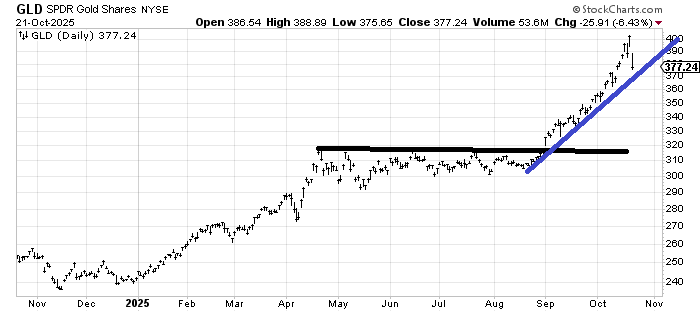
Folks are still asking where to buy gold. My answer is: it should not be WHERE but WHEN. I did not know in April when GLD had peaked that it would take nearly five months before the setup was right again. I did not know that the price would not be much different than where it was in April. What I did know, same as today, is that it had gone too far and speculation had run amok.
Will that blue line break? My guess is the chart folks will be quite excited to buy in that 365-370 area, as the line is there and 370 fills a gap. But for me, I would need a pattern to set up much the way it set up back in late August. In fact, in late August, no one was asking where/when to buy GLD because it had been dead money for so long, no one cared anymore. I suspect we will get to the point that I stop getting asked.
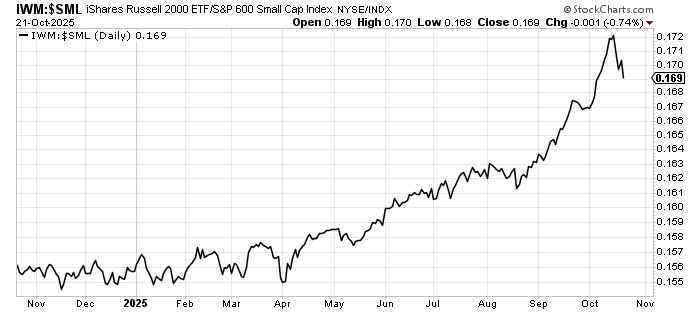
In the meantime, the down-and-outs got a chance to rally on Tuesday. We see it most acutely in the ratio of IWM to SML. We looked at this last week. As a reminder, IWM does not require companies to be profitable, while SML does. SML has been outperforming for the first time all month, and ex the blip in late September, this is really the first time since mid-August. So maybe we’re finally getting that group rotation into Quality over Garbage.
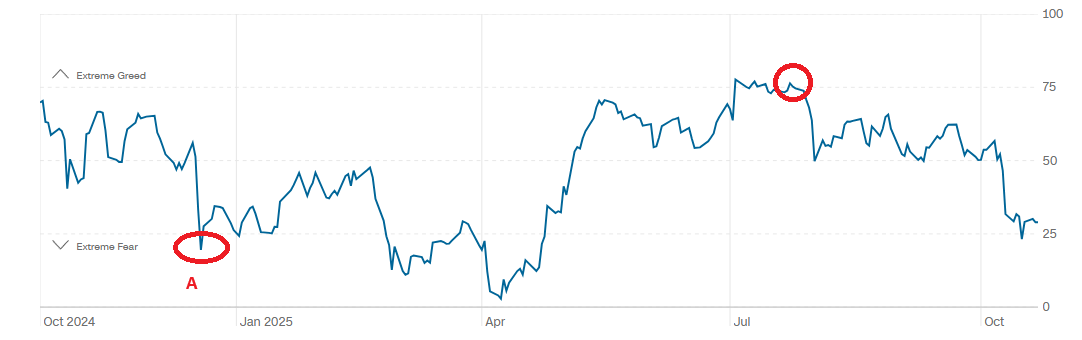
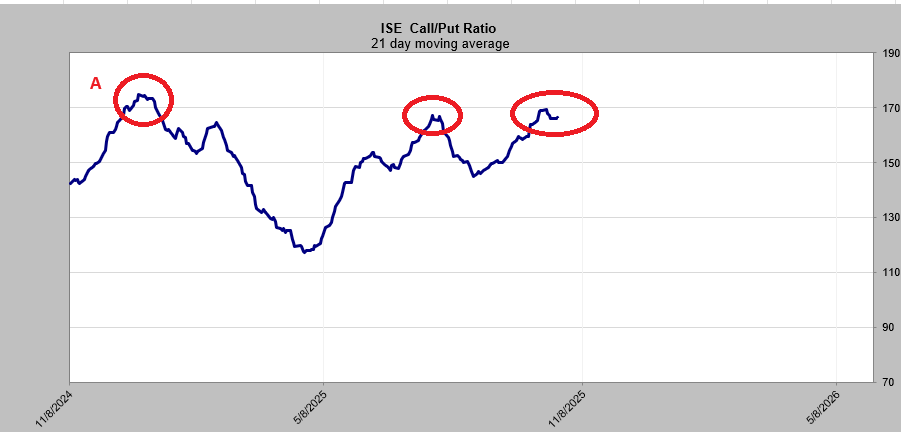
Turning to sentiment, I have been asked why I think the CNN Fear and Greed Indicator is showing FEAR when other indicators, such as the Citi Panic/Euphoria, are not. I can’t say why exactly because I do not know the inputs to the Citi Panic/Euphoria Model (it is proprietary). What I can tell you is that if we use one simple sentiment indicator, the 21-day moving average of the ISE call/put ratio, we see three peaks in the last year.
At one peak, in late December, the Fear and Greed was at point A on the chart. Stocks rallied and then collapsed about two months later. Notice that Fear and Greed never even got to 50 on that rally.
Then, in late July, Fear and Greed got to Extreme Greed at the same time that the ISE ratio also saw an extreme. The S&P did not correct at all. But you know what did? The majority if stocks—see the McClellan Summation Index and its downward slope since July.
So, do you believe we are in late December last year, or do you think this is more like April? Since there is no other sentiment indicator that is down hovering in Fear, I’ll point out that maybe it’s not worth fussing over the outlier.