A Death Cross Prediction
If we look backwards, we can understand what's coming next for the moving averages.
You've reached your free article limit
You've read 0 of 1 free Pro articles.
Here’s a prediction. If the market doesn’t rally in the next week or so, we can expect to hear chatter about a Death Cross in the Russell 2000.
A little history first. The Japanese are said to have been the first to use and apply technical analysis hundreds of years ago. They did so in the rice trading markets. The Japanese are big fans of moving average lines, specifically the five and twenty-five periods.
They have a strong view that when the five-day crosses the 25-day (or any period, but we’ll use days for this example)—and here’s the key—they are both moving in the same direction—you want to go with that. So if the five-day crosses the 25-day to the upside, it’s called a Golden Cross (buy). If the five-day crosses the 25-day to the downside, it’s called a Black Cross (sell).
Somewhere along the line, US traders decided they liked this use of the moving average lines, but they changed it to their liking. They decided that a Golden Cross is the 50-day moving up through the (rising) 200-day moving average. They also decided that when the 50-day crosses under the 200-day moving average to the downside, it is called a Death Cross (as opposed to the original Black Cross).
I have never been a big advocate of Golden and Black (Death) Crosses because I have seen them work and not work. But I typically like to acknowledge them. Fifty trading days ago was early January, so any stock or index trading at a lower price today than early January has its 50-day moving average heading down.
Two hundred trading days ago was early June. So, any stock or index that has its current price trading lower than it was in June will have its moving average line heading down. A moving average line that heads upward is much easier to recapture than one that is heading down.
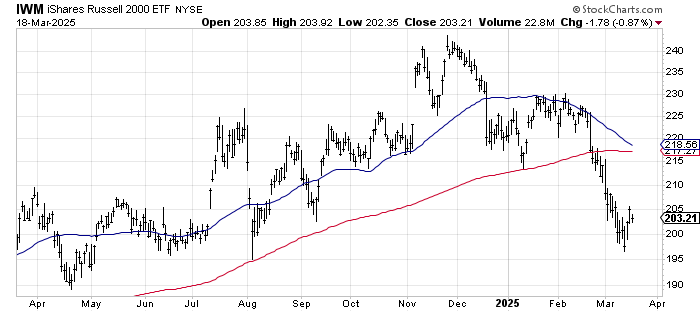
IWM, the ETF I will use for the Russell now has its two moving average lines just over one point apart. We already know the 50-day moving average is heading down (blue line). In early June the IWM was trading just around 200, pretty much where we are now. But remember that massive surge in the small caps we saw in July? In a month’s time, the IWM’s 200-day moving average will drop those numbers.
So, if the IWM can’t rally hard between now and a month from now, we’ll have the 50-day moving average scoot under the 200-day moving average, with both heading down. And we should expect a lot of chatter about Death Crosses should that happen.
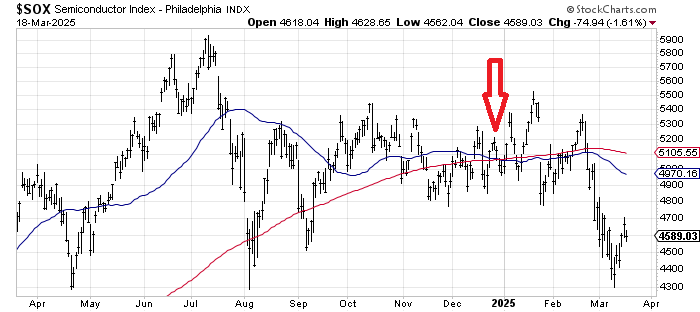
There wasn’t much chatter about the one in the SOX, perhaps because it happened during the holidays, and everyone was still bullish. You can see it didn’t much matter until February when that 200-day moving average rolled over (it was dropping the May rally).
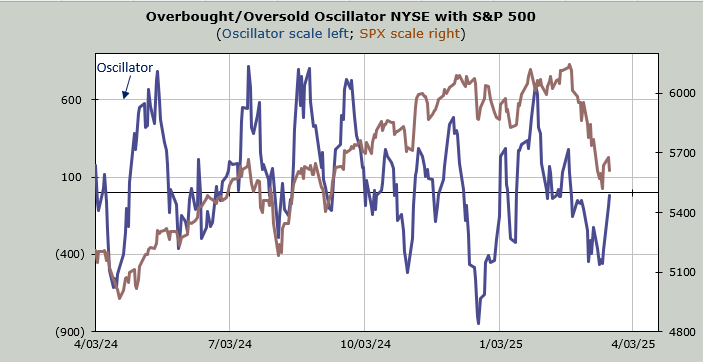
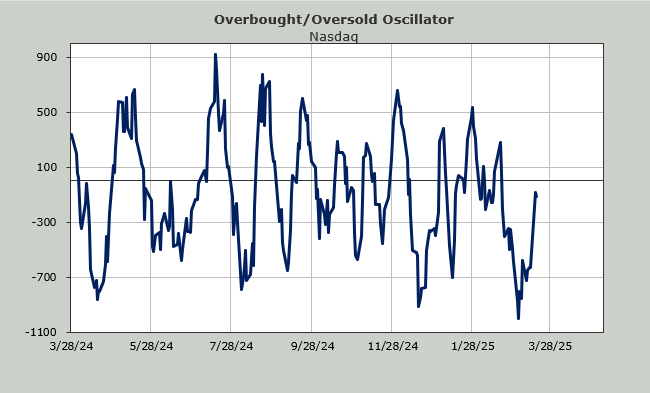
As for the market on Tuesday, it was more of the same. The index movers got smacked around, and everything else churned. The indicators didn’t even change except that the Oscillators inched closer to the zero line.