A Correction Is the Market’s Way of Changing Leadership
Friday was a tough day, but the reality is that we're still stuck in a range. Nothing really broke down.
You've reached your free article limit
You've read 0 of 1 free Pro articles.
Believe it or not, while the charts look different because of Friday’s whack, the reality is that we’re still in the range. Nothing really broke down on Friday. But we did see growth in the list of charts that are close to breaking down.
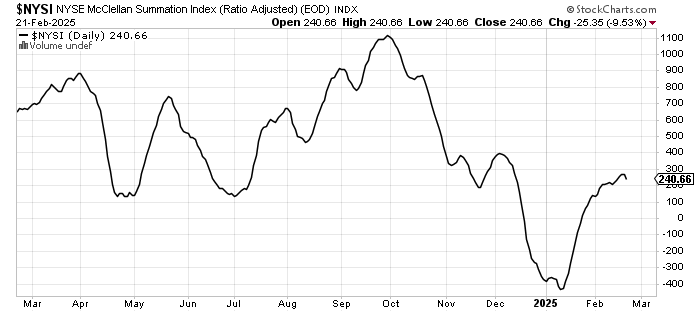
We also saw the McClellan Summation Index roll over. I noted last week that if that particular indicator rolled over, then I thought we’d have a rocky end of February and into early March because the setup was there. The indicator now needs a net differential of +1300 advancers minus decliners to halt the decline. That’s the biggest change from Friday’s giveback.
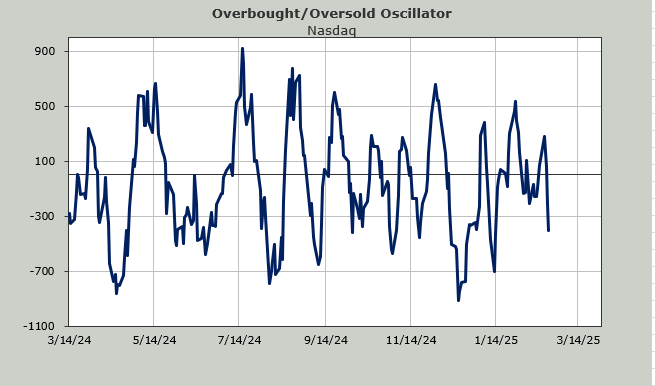
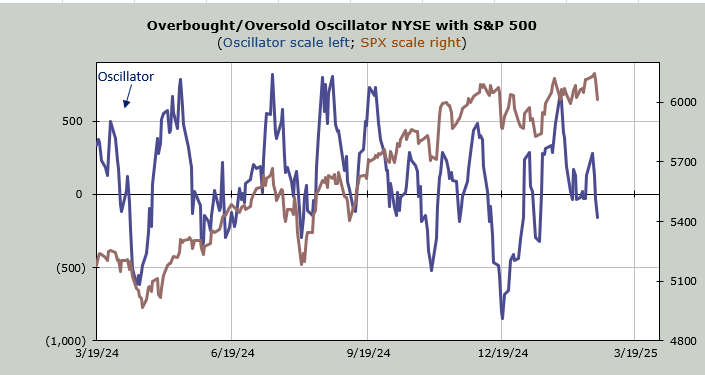
If we look at the Overbought/Oversold Oscillator, many will say it’s oversold. But as long-time readers know, it’s the math behind the indicator that matters. Monday, if the market doesn’t collapse, is likely to see this lift. But after that, the ensuing week doesn’t see us dropping much in the way of red numbers.
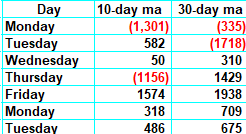
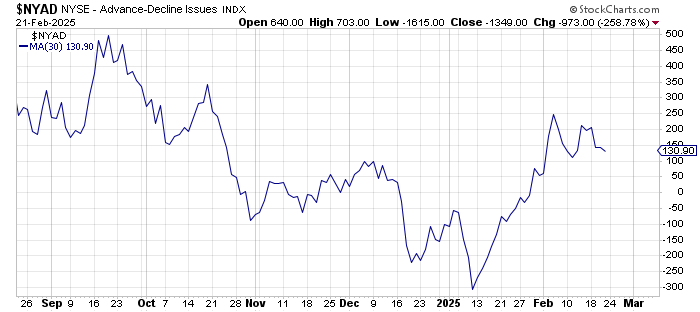
Even if we look at the 30-day moving average of the advance/decline line (a more intermediate-term Oscillator), we can see the early part of this week is friendly to the market but not the next five days.
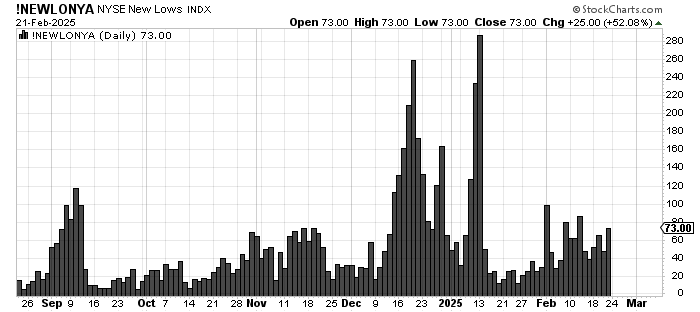
On a more positive note, the number of stocks making new lows did not expand. Probably because the stocks that were down and out, namely staples and drugs, found some love. But we should not rationalize the indicator; there was no expansion in new lows.
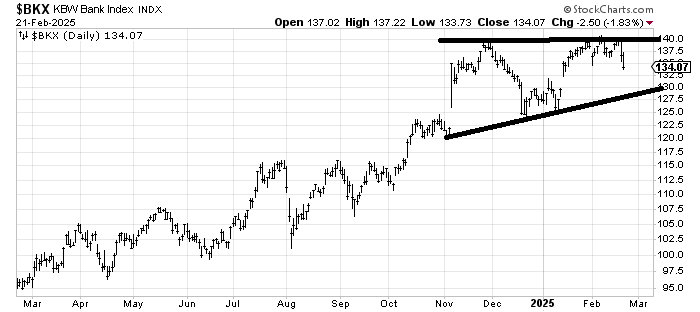
For weeks, we have been staring at that chart of the SOX, which could not and still hasn’t broken down. But we also watched the Bank Index, which couldn’t break out. On Friday, the Bank Index made a lower low under the DeepSeek low. That tells me folks are selling their winners.
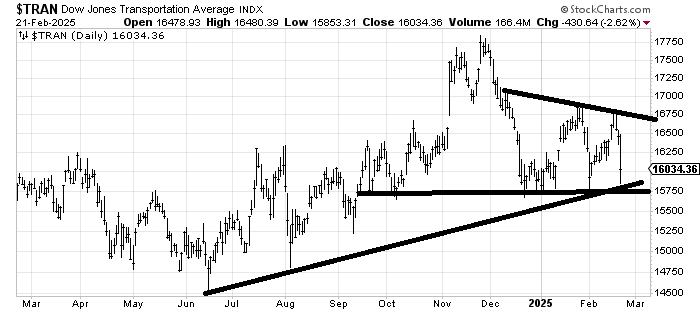
The Transports are at a critical level in that they have not broken it since October. I’m not quite sure that a break is dire since there is support all the way down, but it tells us something if the Transports make a lower low.
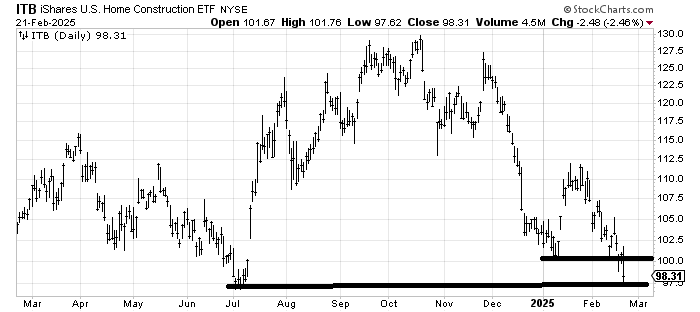
ITB, which you may recall is on that ‘list’, is now hovering at that prior support as well. It could not recapture 100.
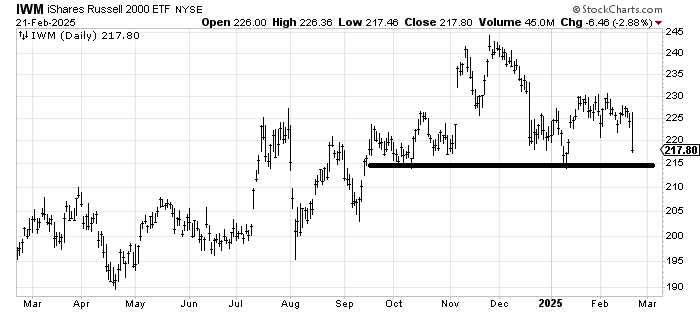
Microsoft is still on the list (i.e., it has not broken that 405 area), but now we should add IWM to the list. Many are fussing because it is at the 200-day moving average line, but we have looked at this chart before and noted that 215 level.
Over the last few months, we have seen rampant speculation in coins, crypto, quantum, and probably a bunch of other stuff I don’t even know about. But we have also seen the loss of the Magnificent Seven as they have dwindled in numbers. Yet the indexes have remained in this big trading range of chop. I learned many years ago that corrections are the market’s way of changing leadership.
It is difficult to get sentiment to be all in on the bull or the bear side when the market is in a chop fest. That’s why I will continue to watch to see if these charts that threaten to break actually do. I suspect breakdowns will change sentiment.