The Great Diversification Illusion: Why Your Funds May Be Moving in Lockstep
Are you really diversified? More funds may not protect your portfolio from overlap.
You've reached your free article limit
You've read 0 of 1 free Pro articles.
 Portfolio
You may be familiar with Jim Cramer’s “are you diversified” segment on CNBC’s “Mad Money.”
A caller presents a handful of stocks and Jim determines whether they truly hold disparate investments or if multiple holdings are concentrated in the same sector.
If that’s the case, many of the holdings are likely to be driven by the same economic forces or tied to the same market themes. There’s a decent chance these stocks will move in tandem, which is a problem if a particular sector or industry gets hit harder than others at any given time.
You can apply that same thought process to your long-term or retirement investments.
A typical portfolio might look well diversified on the surface because it holds different funds or stocks.
Even sophisticated investors can find duplicate or highly correlated positions lurking in their portfolio. It’s easy for that to happen, if you add positions over time or simply haven’t been paying too much attention to a long-term account.
High Correlation, Hidden Risk
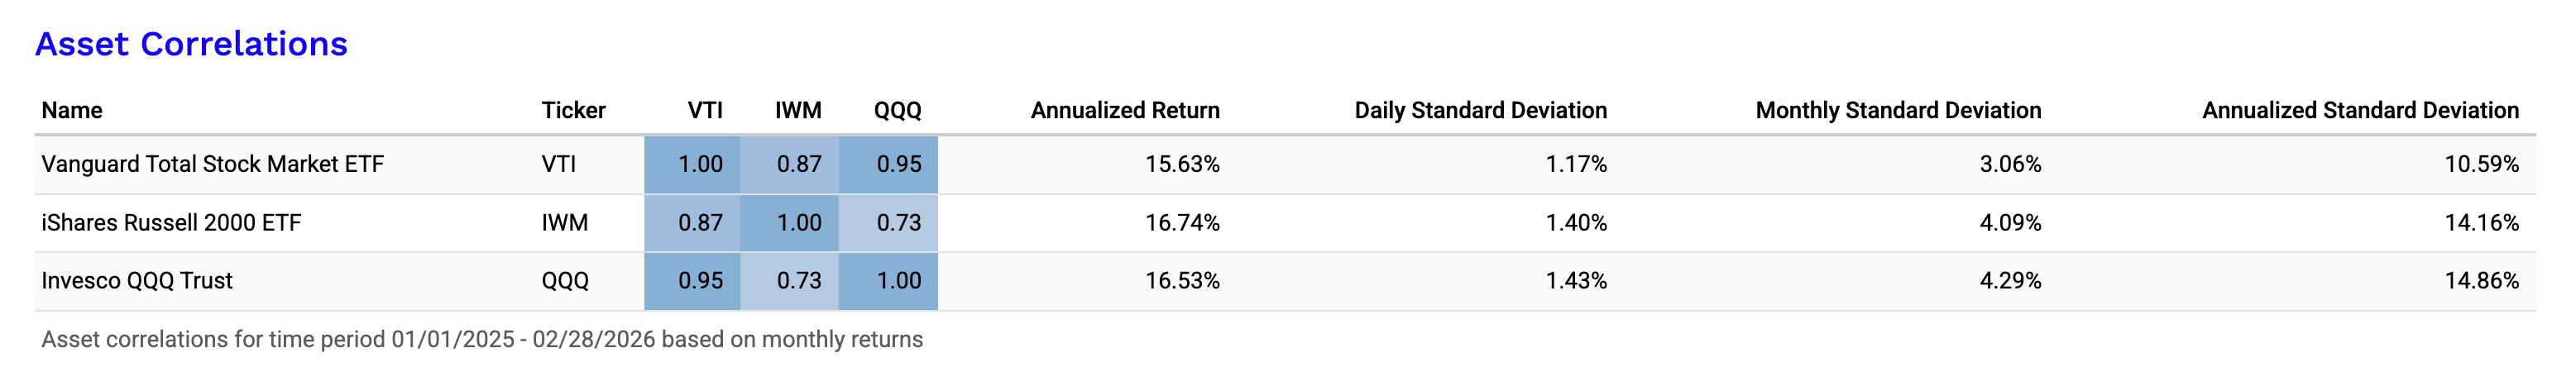
Here’s a look at the correlations between three U.S. stock funds, from January 2025 through February 2026.
- Vanguard Total Stock Market ETF (VTI)
- iShares Russell 2000 ETF (IWM)
- Invesco QQQ Trust (QQQ)
This example is clearly for illustration, but it doesn’t look very diversified given how highly correlated these holdings are: They tend to move together much more than people might expect.
Portfolio Visualizer
That said, I’ve seen plenty of real portfolios built in a similar way, where investors think they’re diversified but are actually concentrated in different versions of the same market exposure.
Concentration Starts at the Core
An S&P 500 fund, which is the core holding in many a portfolio, is heavily concentrated in a handful of mega-cap names.
- Apple (AAPL), Microsoft (MSFT) and Nvidia (NVDA) dominate index weightings.
- The top 10 holdings make up nearly 37% of the index.
- The tech sector accounts for more than one-third of index composition.
Adding a Balanced Fund?
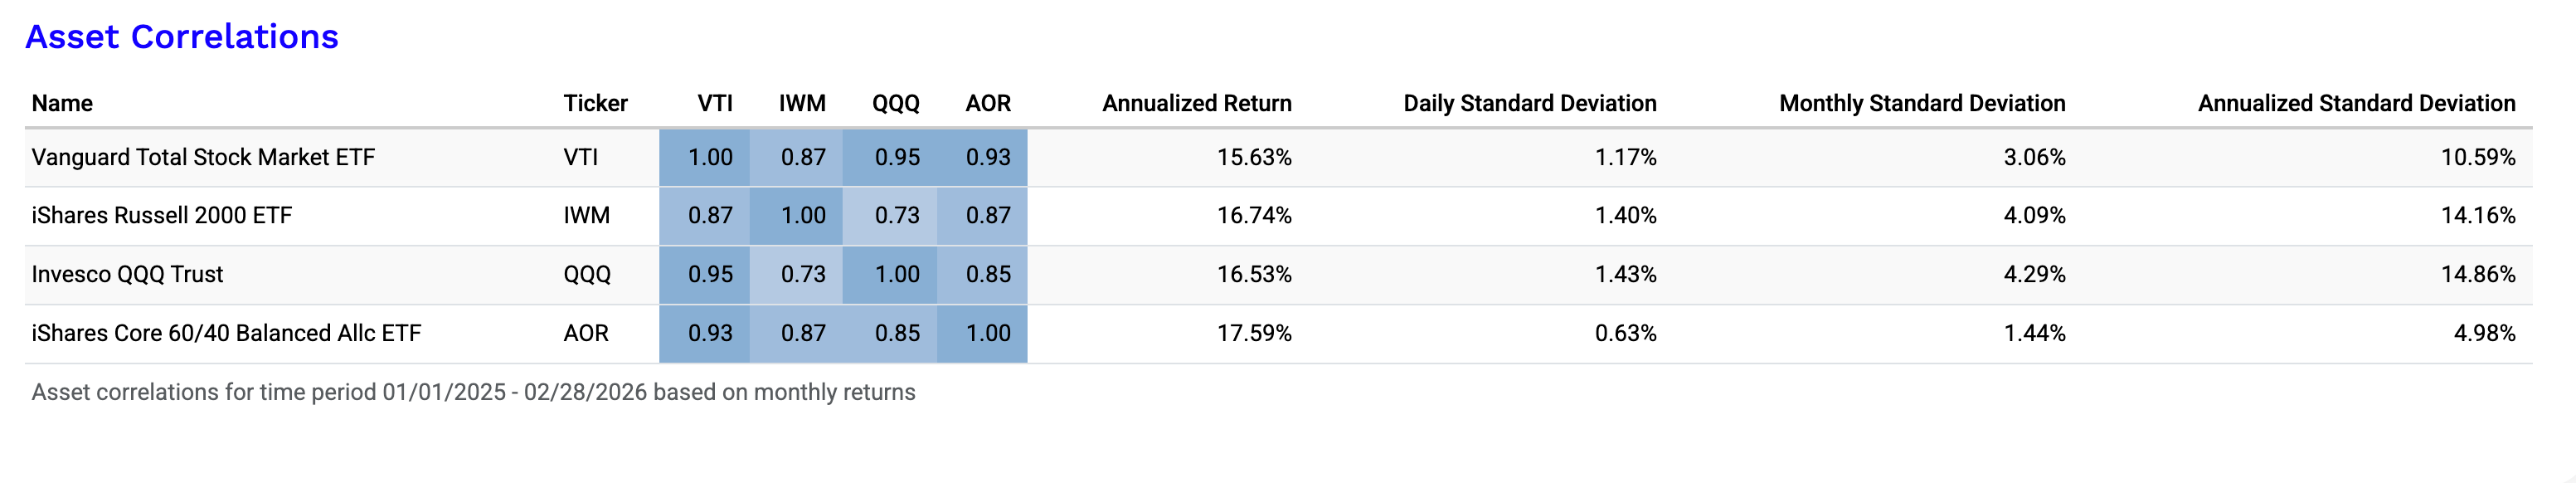
Say you want more fixed income to round things out a bit. So you buy the iShares Core 60/40 Balanced Allocation ETF (AOR).
This introduces bonds, but the equity sleeve often looks familiar.
Portfolio Visualizer
That results in high correlations with pure equity funds.
- AOR is a 60/40 balanced fund, but it’s still heavily influenced by equities, so it tends to move in the same direction as the stock funds.
- Adding AOR reduces volatility, as you can see in the lower standard deviation, but it doesn’t meaningfully improve diversification.
In other words, even the balanced fund is moving with the market, just a little less dramatically.
More Similar Than You Know
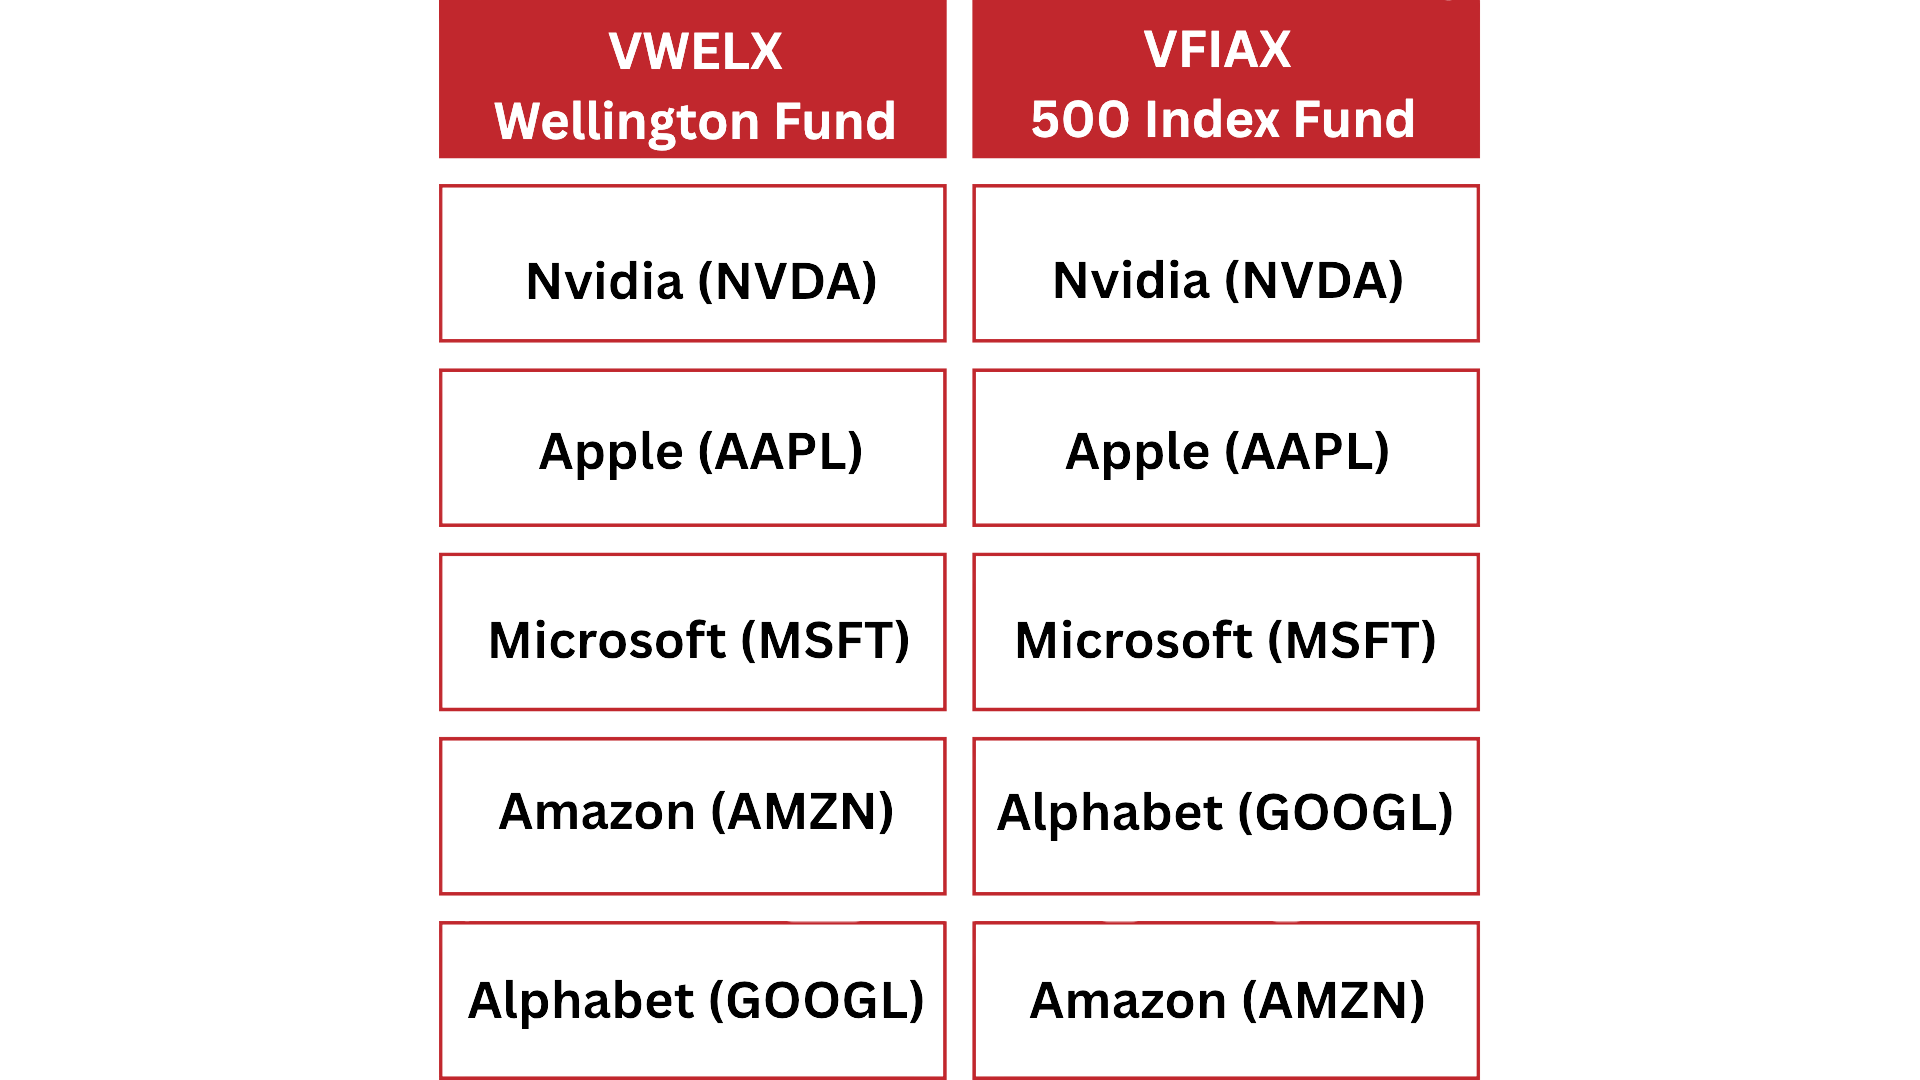
Different fund names don't mean different investments. A "growth" fund and a "blend" fund often own the exact same companies. So does your target-date fund. The labels may be different but the top holdings may not be.
Here’s a comparison of the top five holdings in the Vanguard Wellington Fund (VWELX), a balanced fund, and the Vanguard 500 Index Fund (VFIAX), which tracks the S&P 500.
Vanguard data
The holdings are identical, with just Amazon (AMZN) and Alphabet (GOOGL) switching between fourth and fifth place.
The Problem Compounds Over Time
This is how concentration sneaks up on you. Five different funds may seem diversified. But if all five have Apple (AAPL) , Microsoft (MSFT) , and Nvidia (NVDA) at the top, you don't have five bets. You have one bet, repeated five times.
It gets worse over time. When large-cap stocks outperform, they grow into a bigger slice of every fund that holds them. We’ve all seen that happen to U.S. large cap funds.
Without rebalancing, a portfolio that started balanced gradually turns into a large-cap index fund wearing a disguise.
And there's the other side: What's missing. Small and mid-caps. International stocks. Value strategies. But when market leadership shifts, and it always does, eventually, those gaps widen.
The 10 largest U.S. stocks went from roughly 19% of the entire market in 2015 to over 40% by 2025.
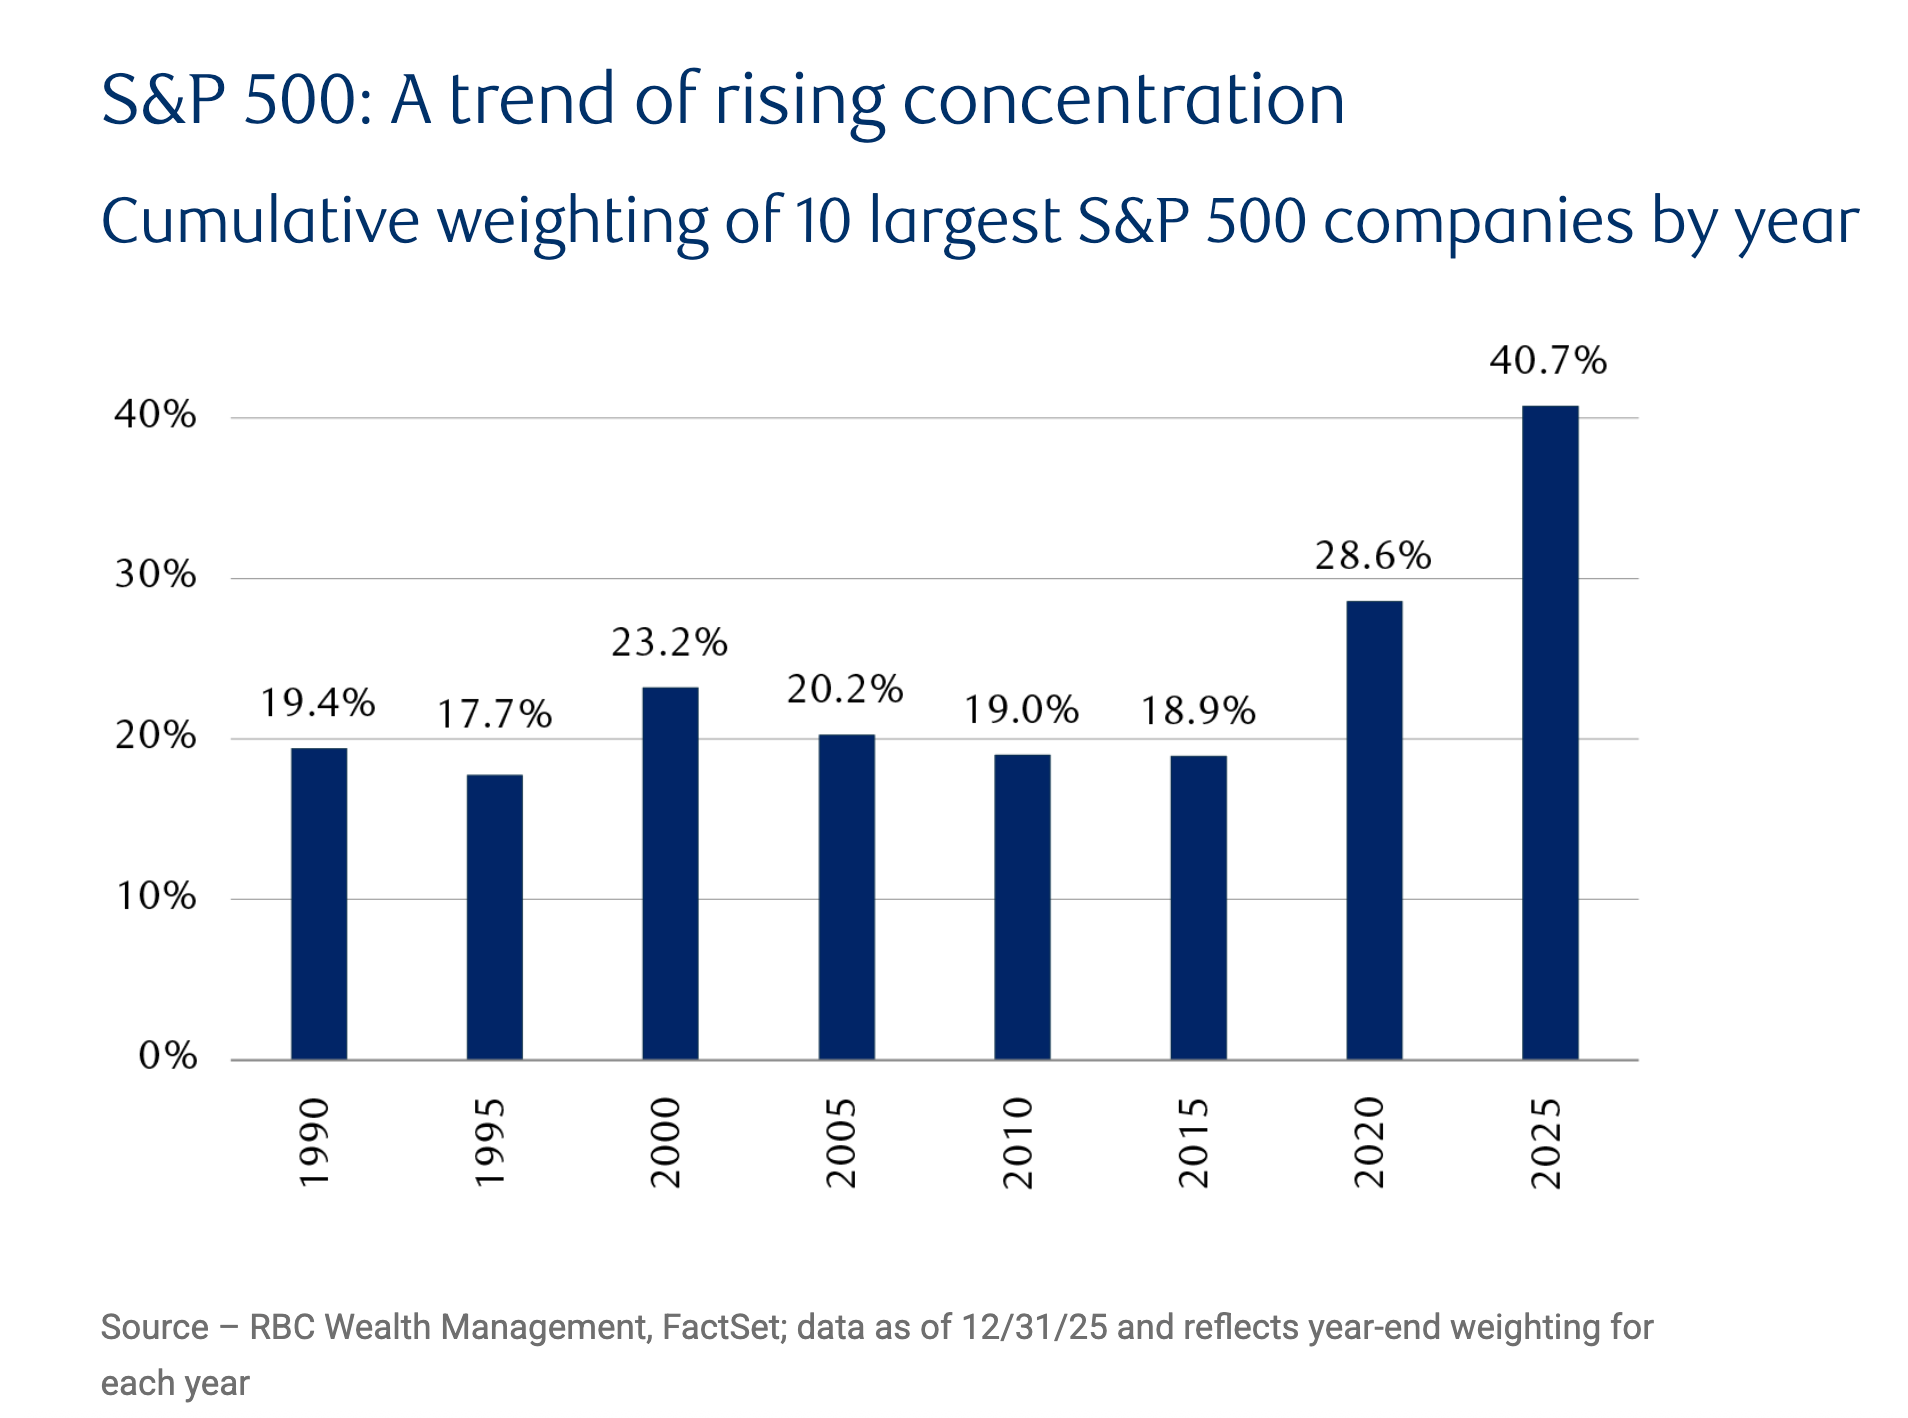
RBC Wealth Management
Roughly one out of every three dollars in a standard S&P 500 index fund sits in just 10 companies. If you own a growth fund, a blend fund, and a target-date fund, you likely own those same 10 stocks three times over without realizing it
Owning more funds, without deliberately adding various asset classes, won’t fix this. It just means more places to find the same stocks.
Related: Charting the Stocks That Will Control the Market’s Next Move
