How to Plan Trades, Manage Risk in an Uncertain Market
With volatility high, now’s a good time to focus on planning trades and managing risk.
You've reached your free article limit
You've read 0 of 1 free Pro articles.
 Risk
Risk
Over the past three years, the S&P 500 has put together a solid winning streak. Here are the stats, based on total return for the large-cap index:
2023: 26.29%
2024: 25.02%
2025: 17.9%
In a forgiving market, it’s easy for traders to drift away from solid risk management techniques. Then when volatility rears its head, as it has recently, we become vulnerable just when we are most in need of those techniques.
Let’s go over the practical application of some risk management techniques and trade planning, starting with mindset.
The Dating Game
When buying a stock, too many investors act as if they’ve taken a marriage vow. They’re going to hold onto that stock for better or worse, for richer or poorer.
This doesn’t translate into good investing. We don’t marry our investments, we date them.
Unlike a relationship, if things are going poorly, there is no need for patience. If the investment isn’t performing as anticipated, we have to be willing to break up at a moment’s notice.
Don’t Go Down With the Ship
Why are so many investors willing to hang on, when they know they should exit? Investors tend to fixate on their entry points. They don’t want to take a loss, so they wait and hope and pray.
This is a cognitive bias known as "anchoring."
For example, a trader buys a stock at $25. Then it drops to $22. The stock’s trading setup is broken. Objectively, he knows he should get out.
Despite evidence to the contrary, he hangs on, hoping for $25. That's because he’s mentally anchored to that price.
How do we defeat anchoring? Imagine that you don’t own the stock. This helps us to view it objectively.
If you didn’t already own it, would you still buy it at $22? If the answer is no, it’s time to get out.
Always Have a Plan
Most of my daily charts contain two moving averages: the 50-day, normally in blue, and the 200-day, which is usually red. Moving averages can be used as a risk management tool.
For example, let’s say you own shares of Dow Inc. (DOW) . Congratulations, your stock just reached a 52-week high.
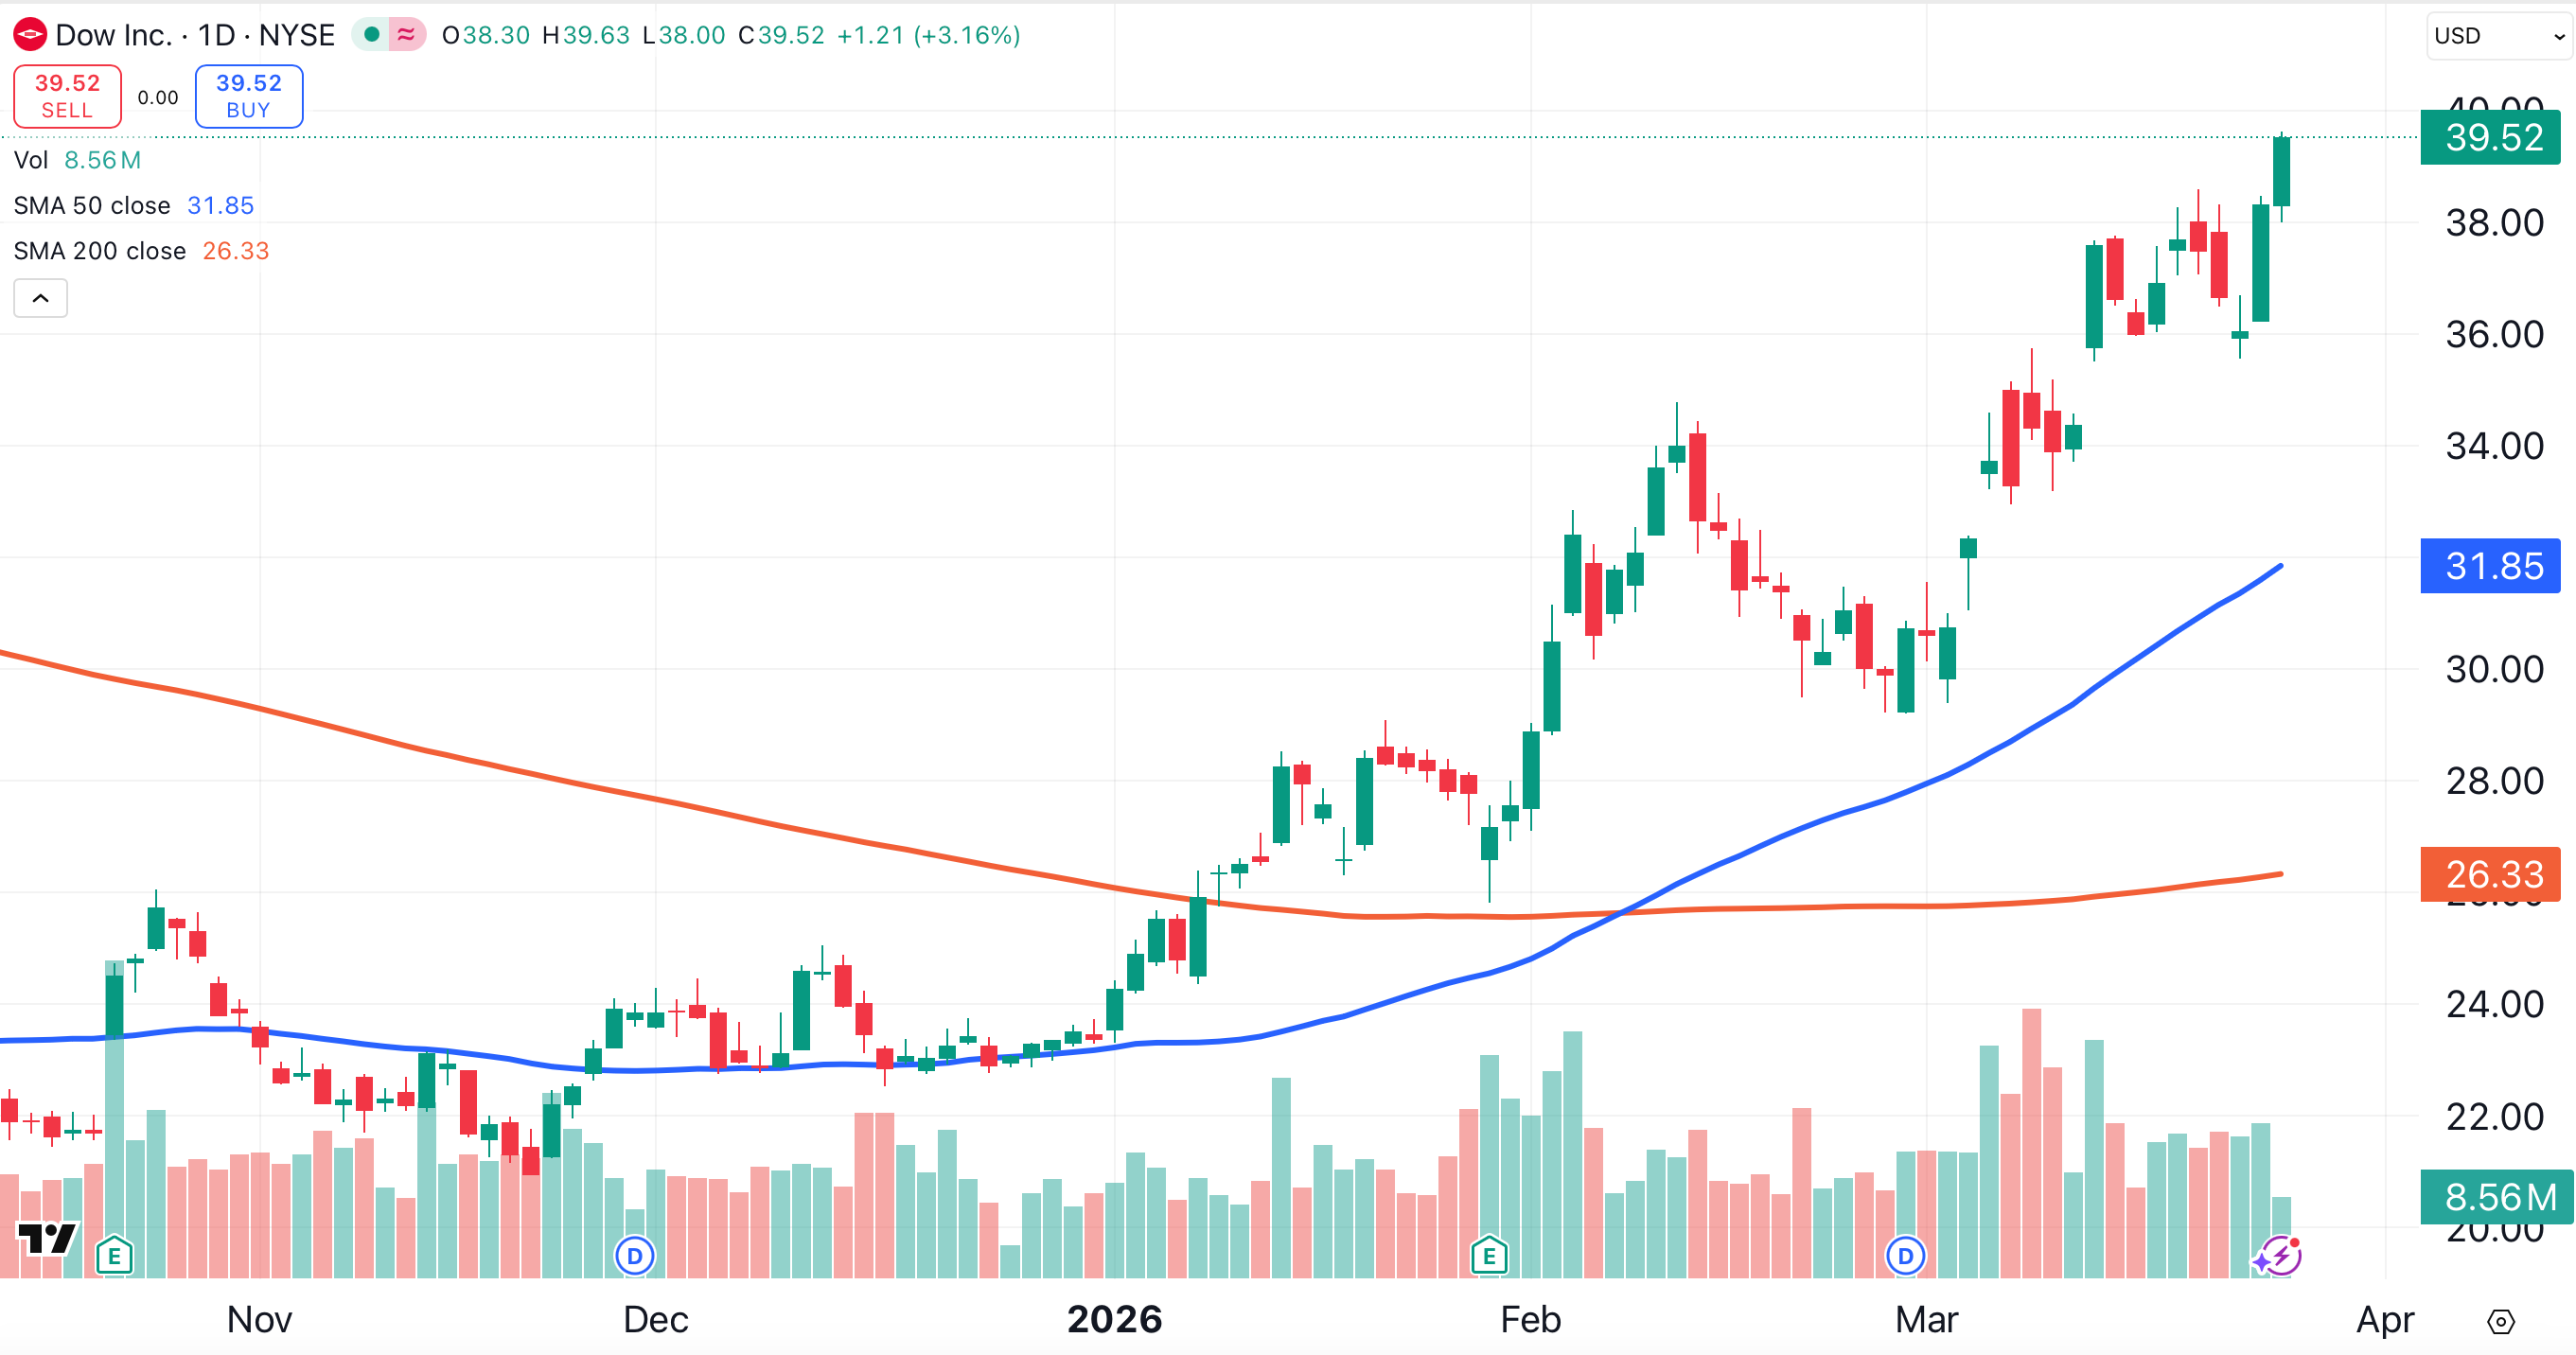
Would you sell this stock if Dow fell below its 50-day moving average (blue), currently located at $31.85?
If the answer is yes, then you have an exit plan. I’m not saying it’s a perfect plan, but at least you have a plan. This puts you miles ahead of the average retail investor.
If the answer is no, when will you get out? If there is no plan, we need to create one.
If your answer is, “It depends on the purchase price,” you are anchored to that price. I fear many of us fall into this third category.
Recognize that this is a problem. The purchase price shouldn’t be a factor in your decision making process.
Dealing With Strong Trends
In case of a very strong trend, I’ll sometimes use a 10-period exponential moving average, trailing the stop beneath that indicator.
Here’s a recent example using the Aussie dollar/New Zealand dollar currency pair, on a weekly chart. Entry price in green, stop in red. Notice how we keep trailing the stop higher:
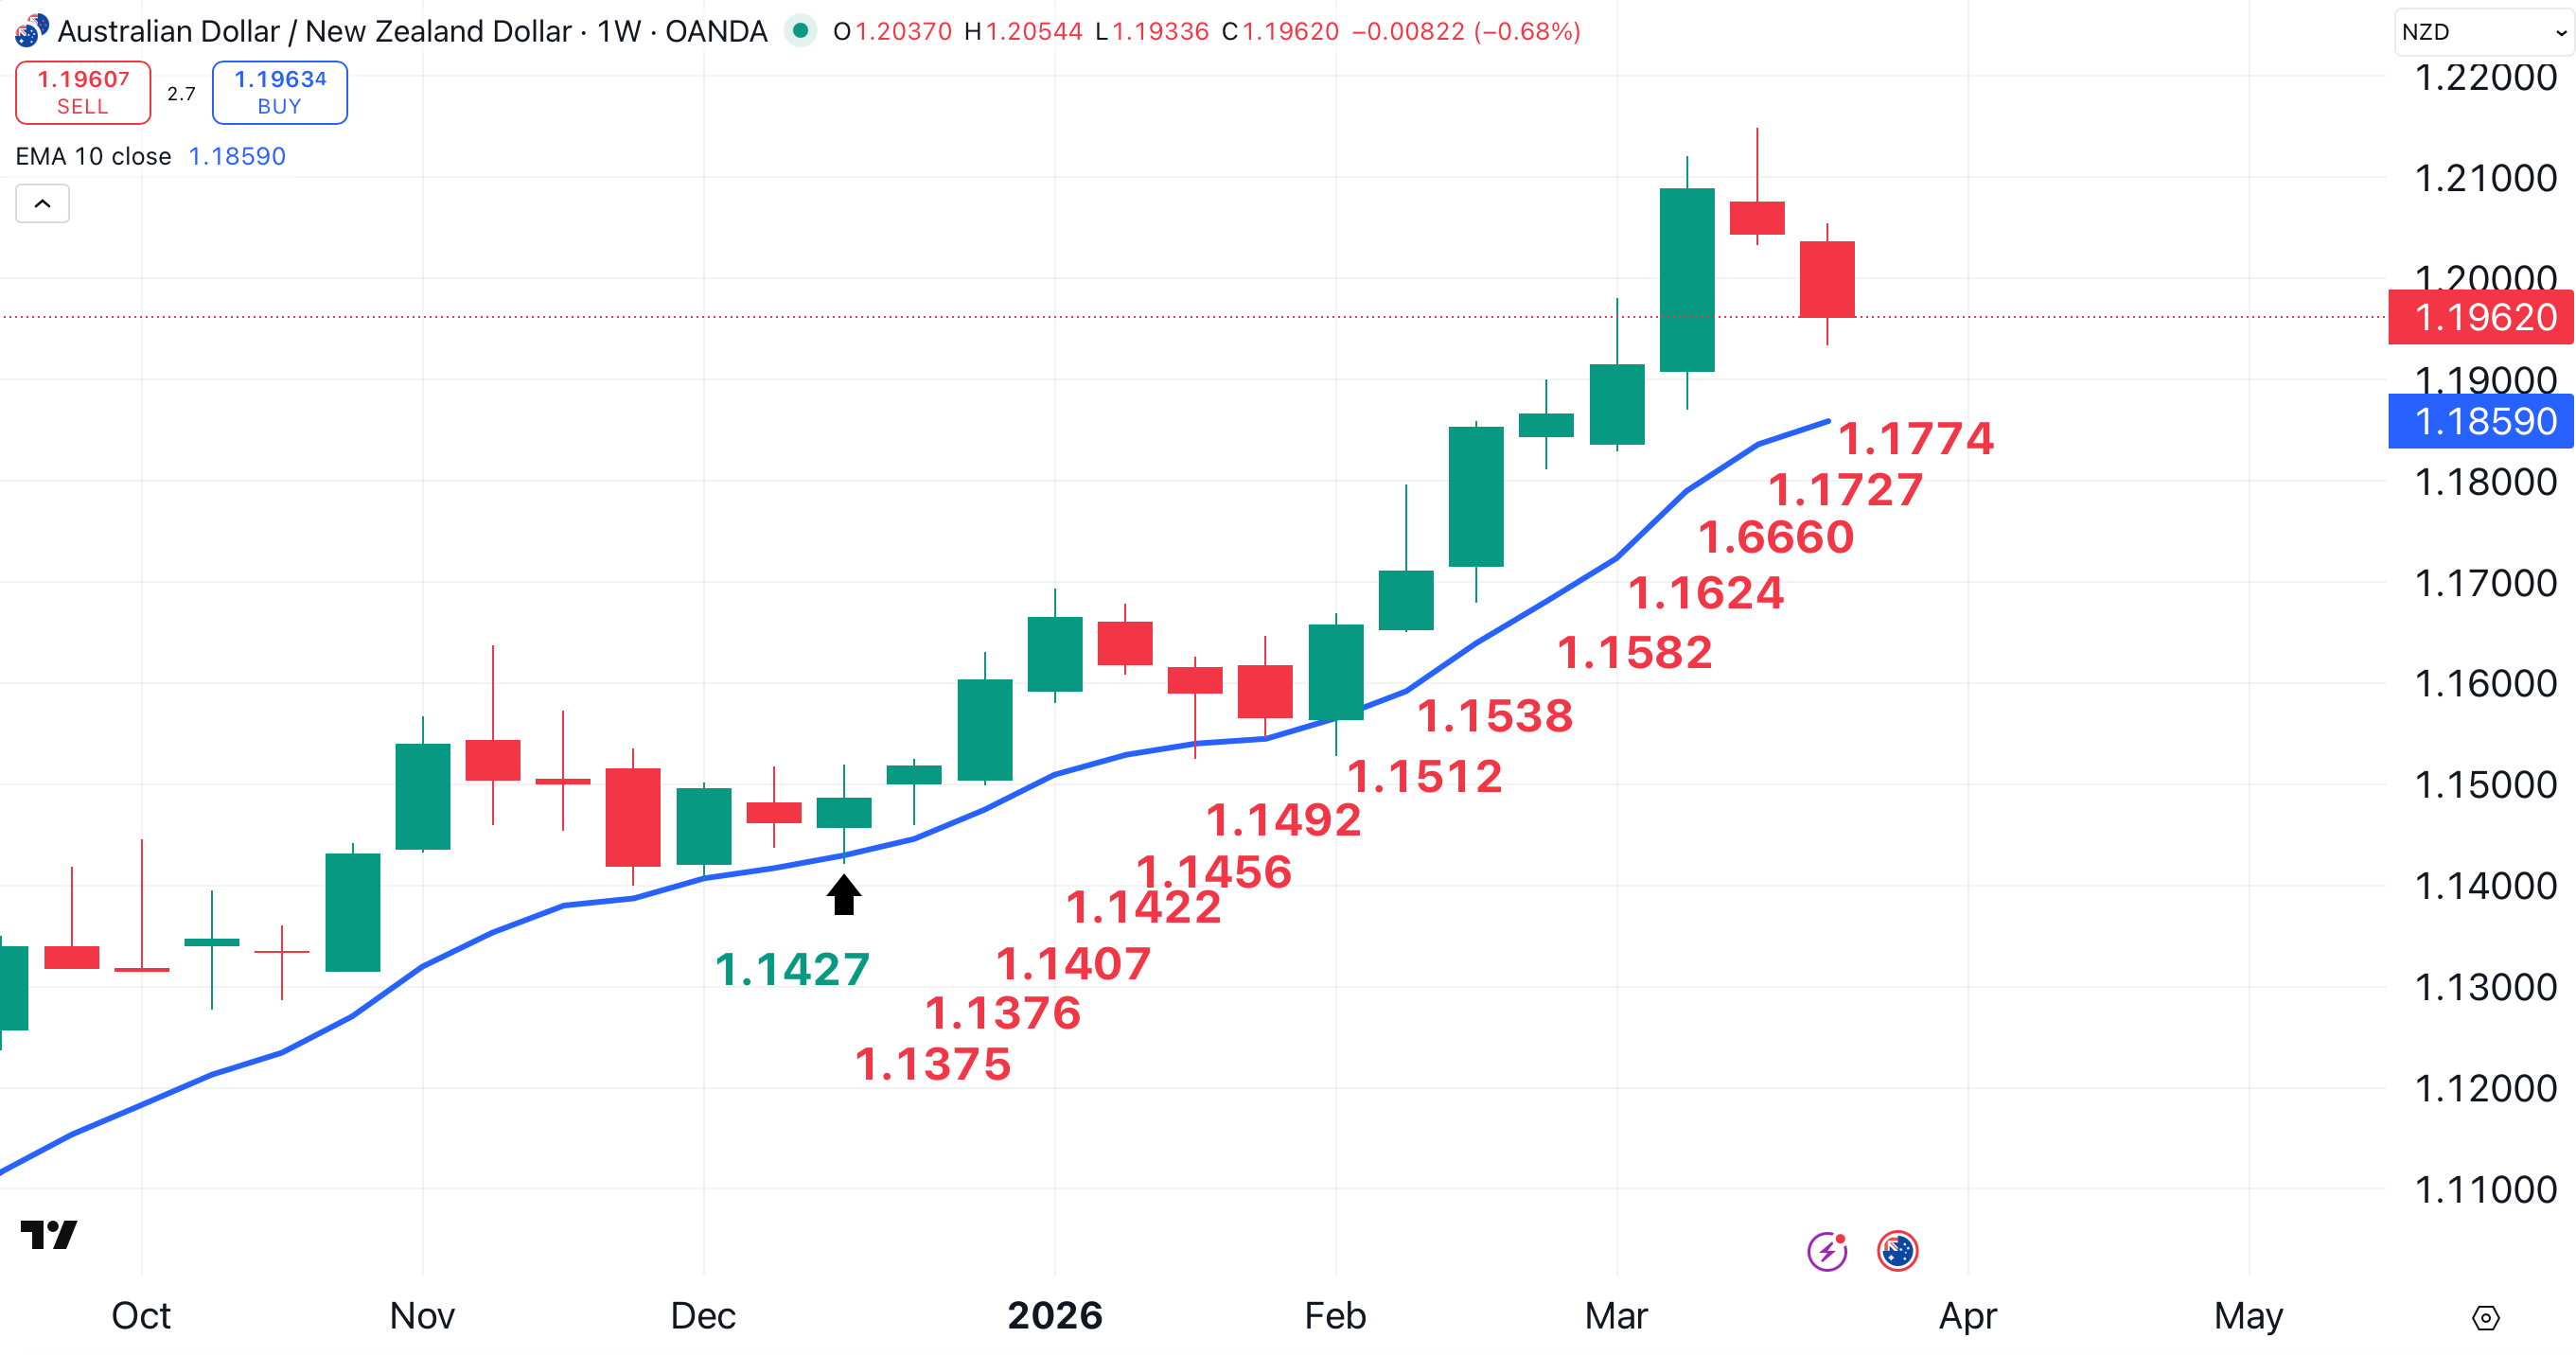
Notice how the stop is always below the moving average. The trade will end when the price breaks through the moving average by a predetermined margin.
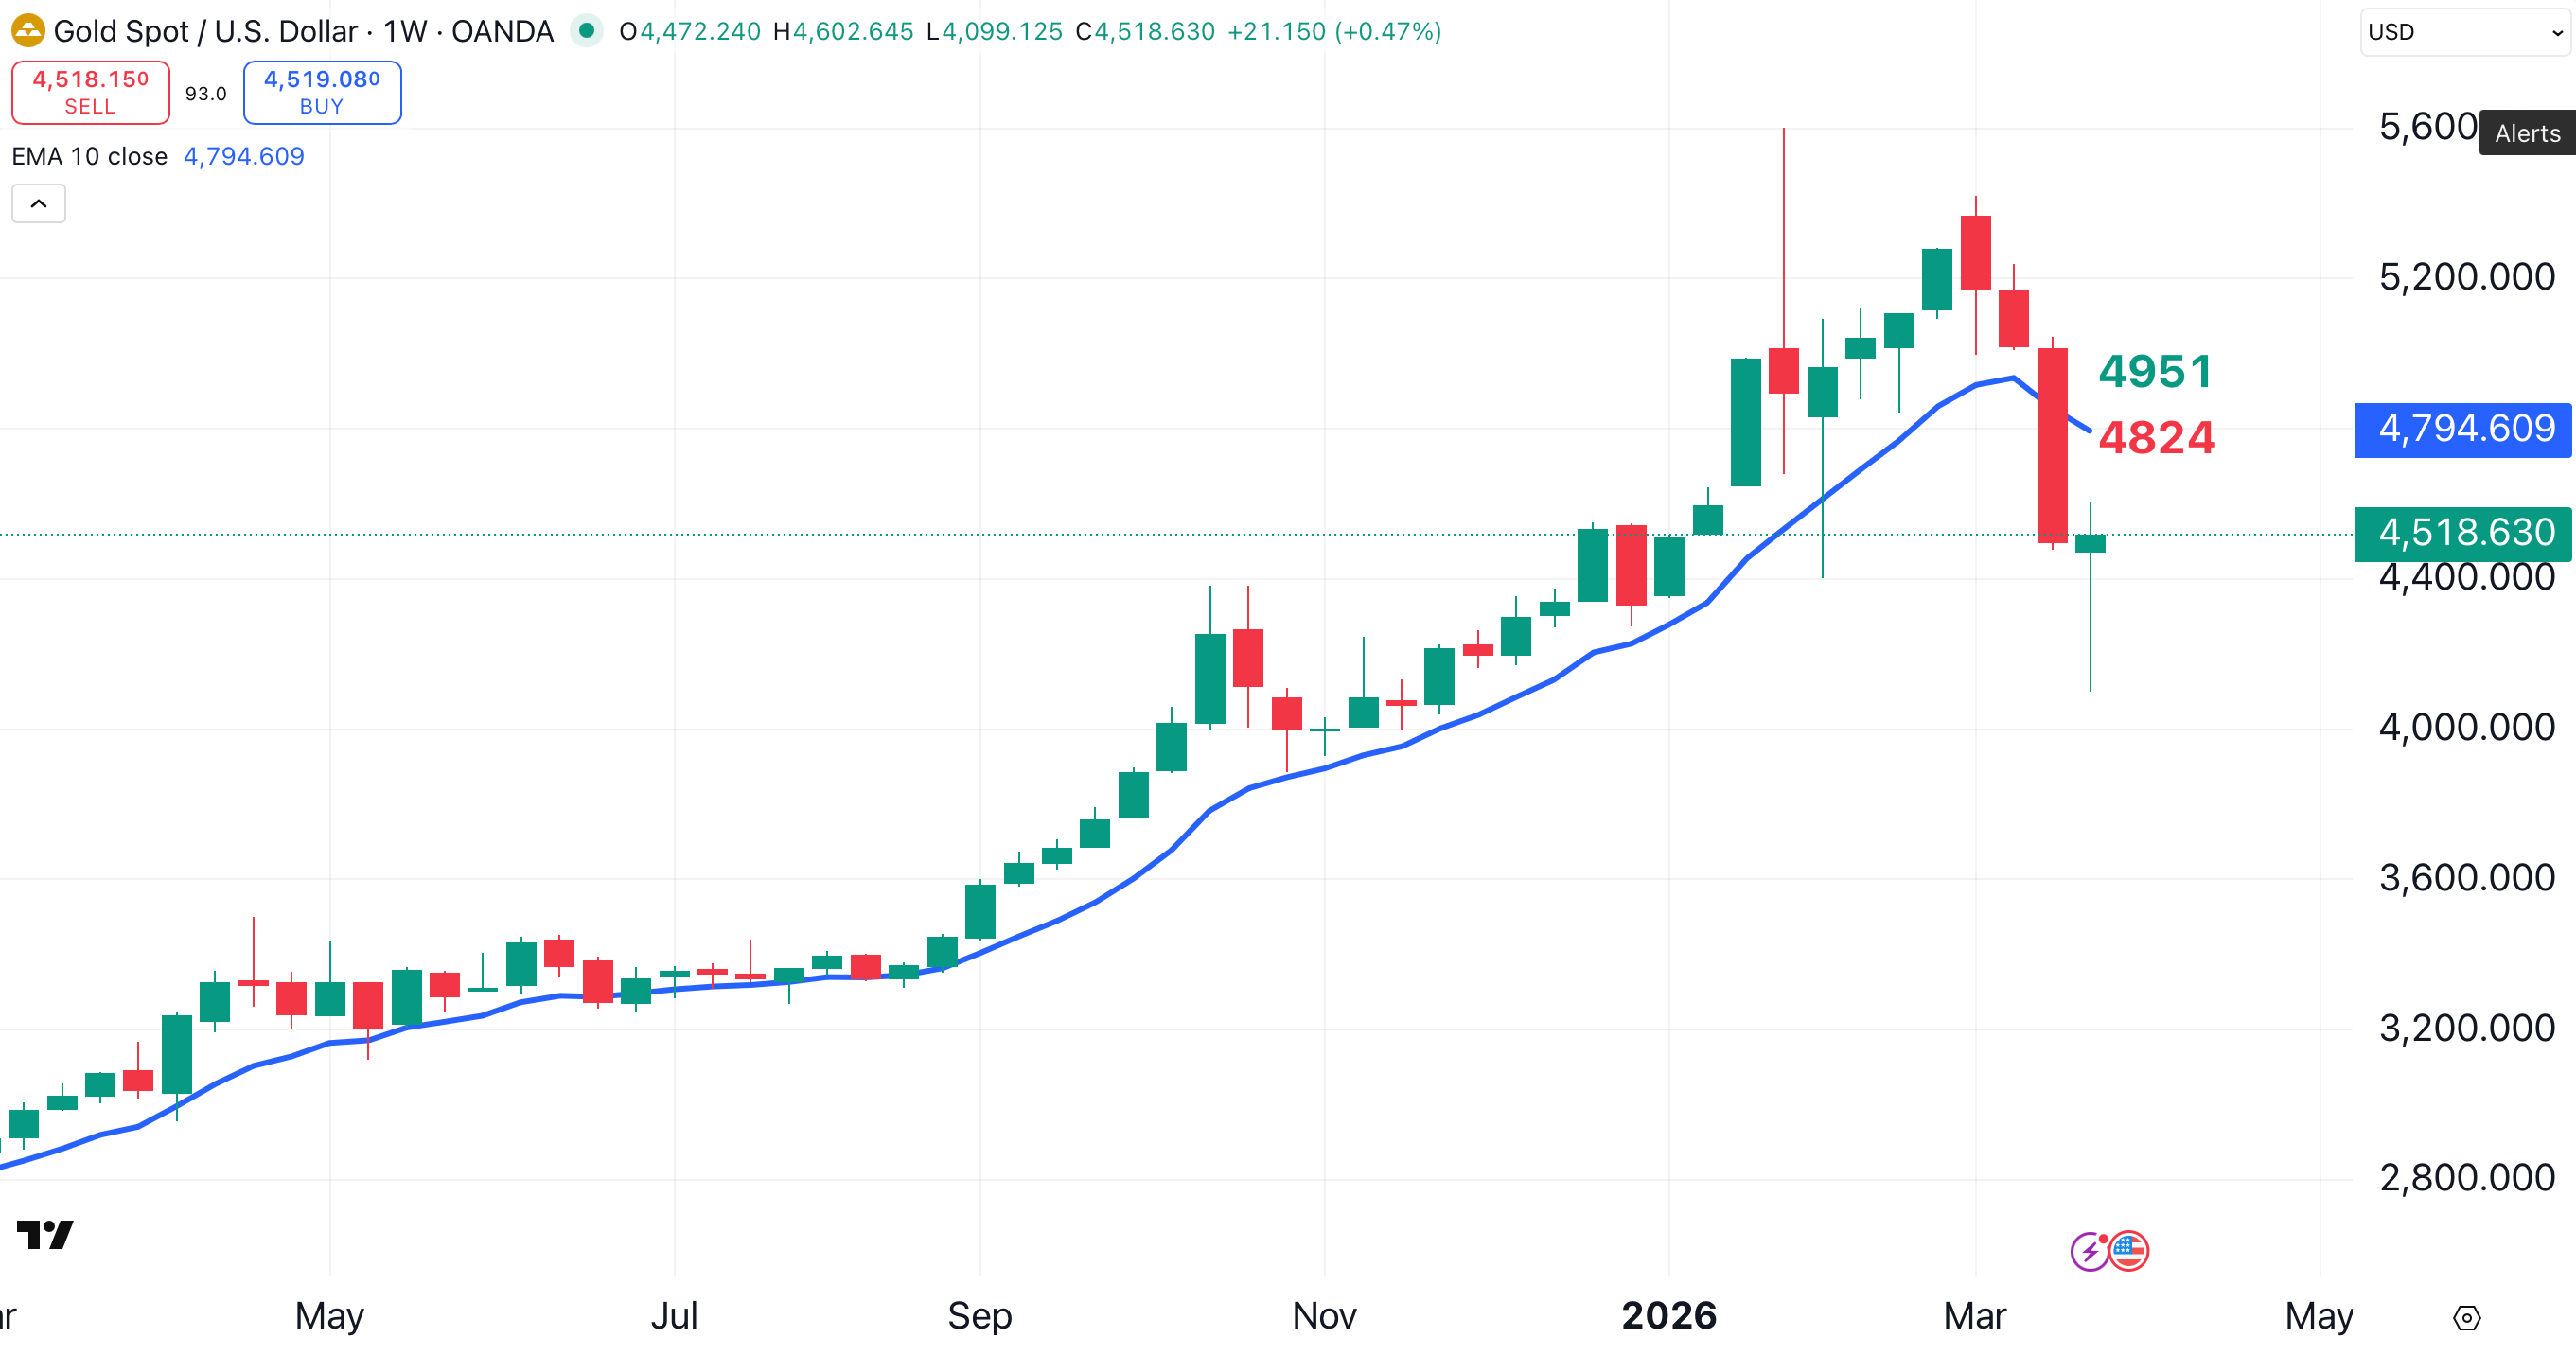
Of course, this technique doesn’t always work, but when it fails, it can protect against a large loss. Here’s a recent example of a failed trade in spot gold. Again, entry in green, stop in red:
A Simple Plan
There are many ways to manage risk, and the use of moving averages isn’t required.
I prefer simple plans. I’d create complex plans if I believed they’d provide better results. However, it’s been my experience that simplicity is superior.
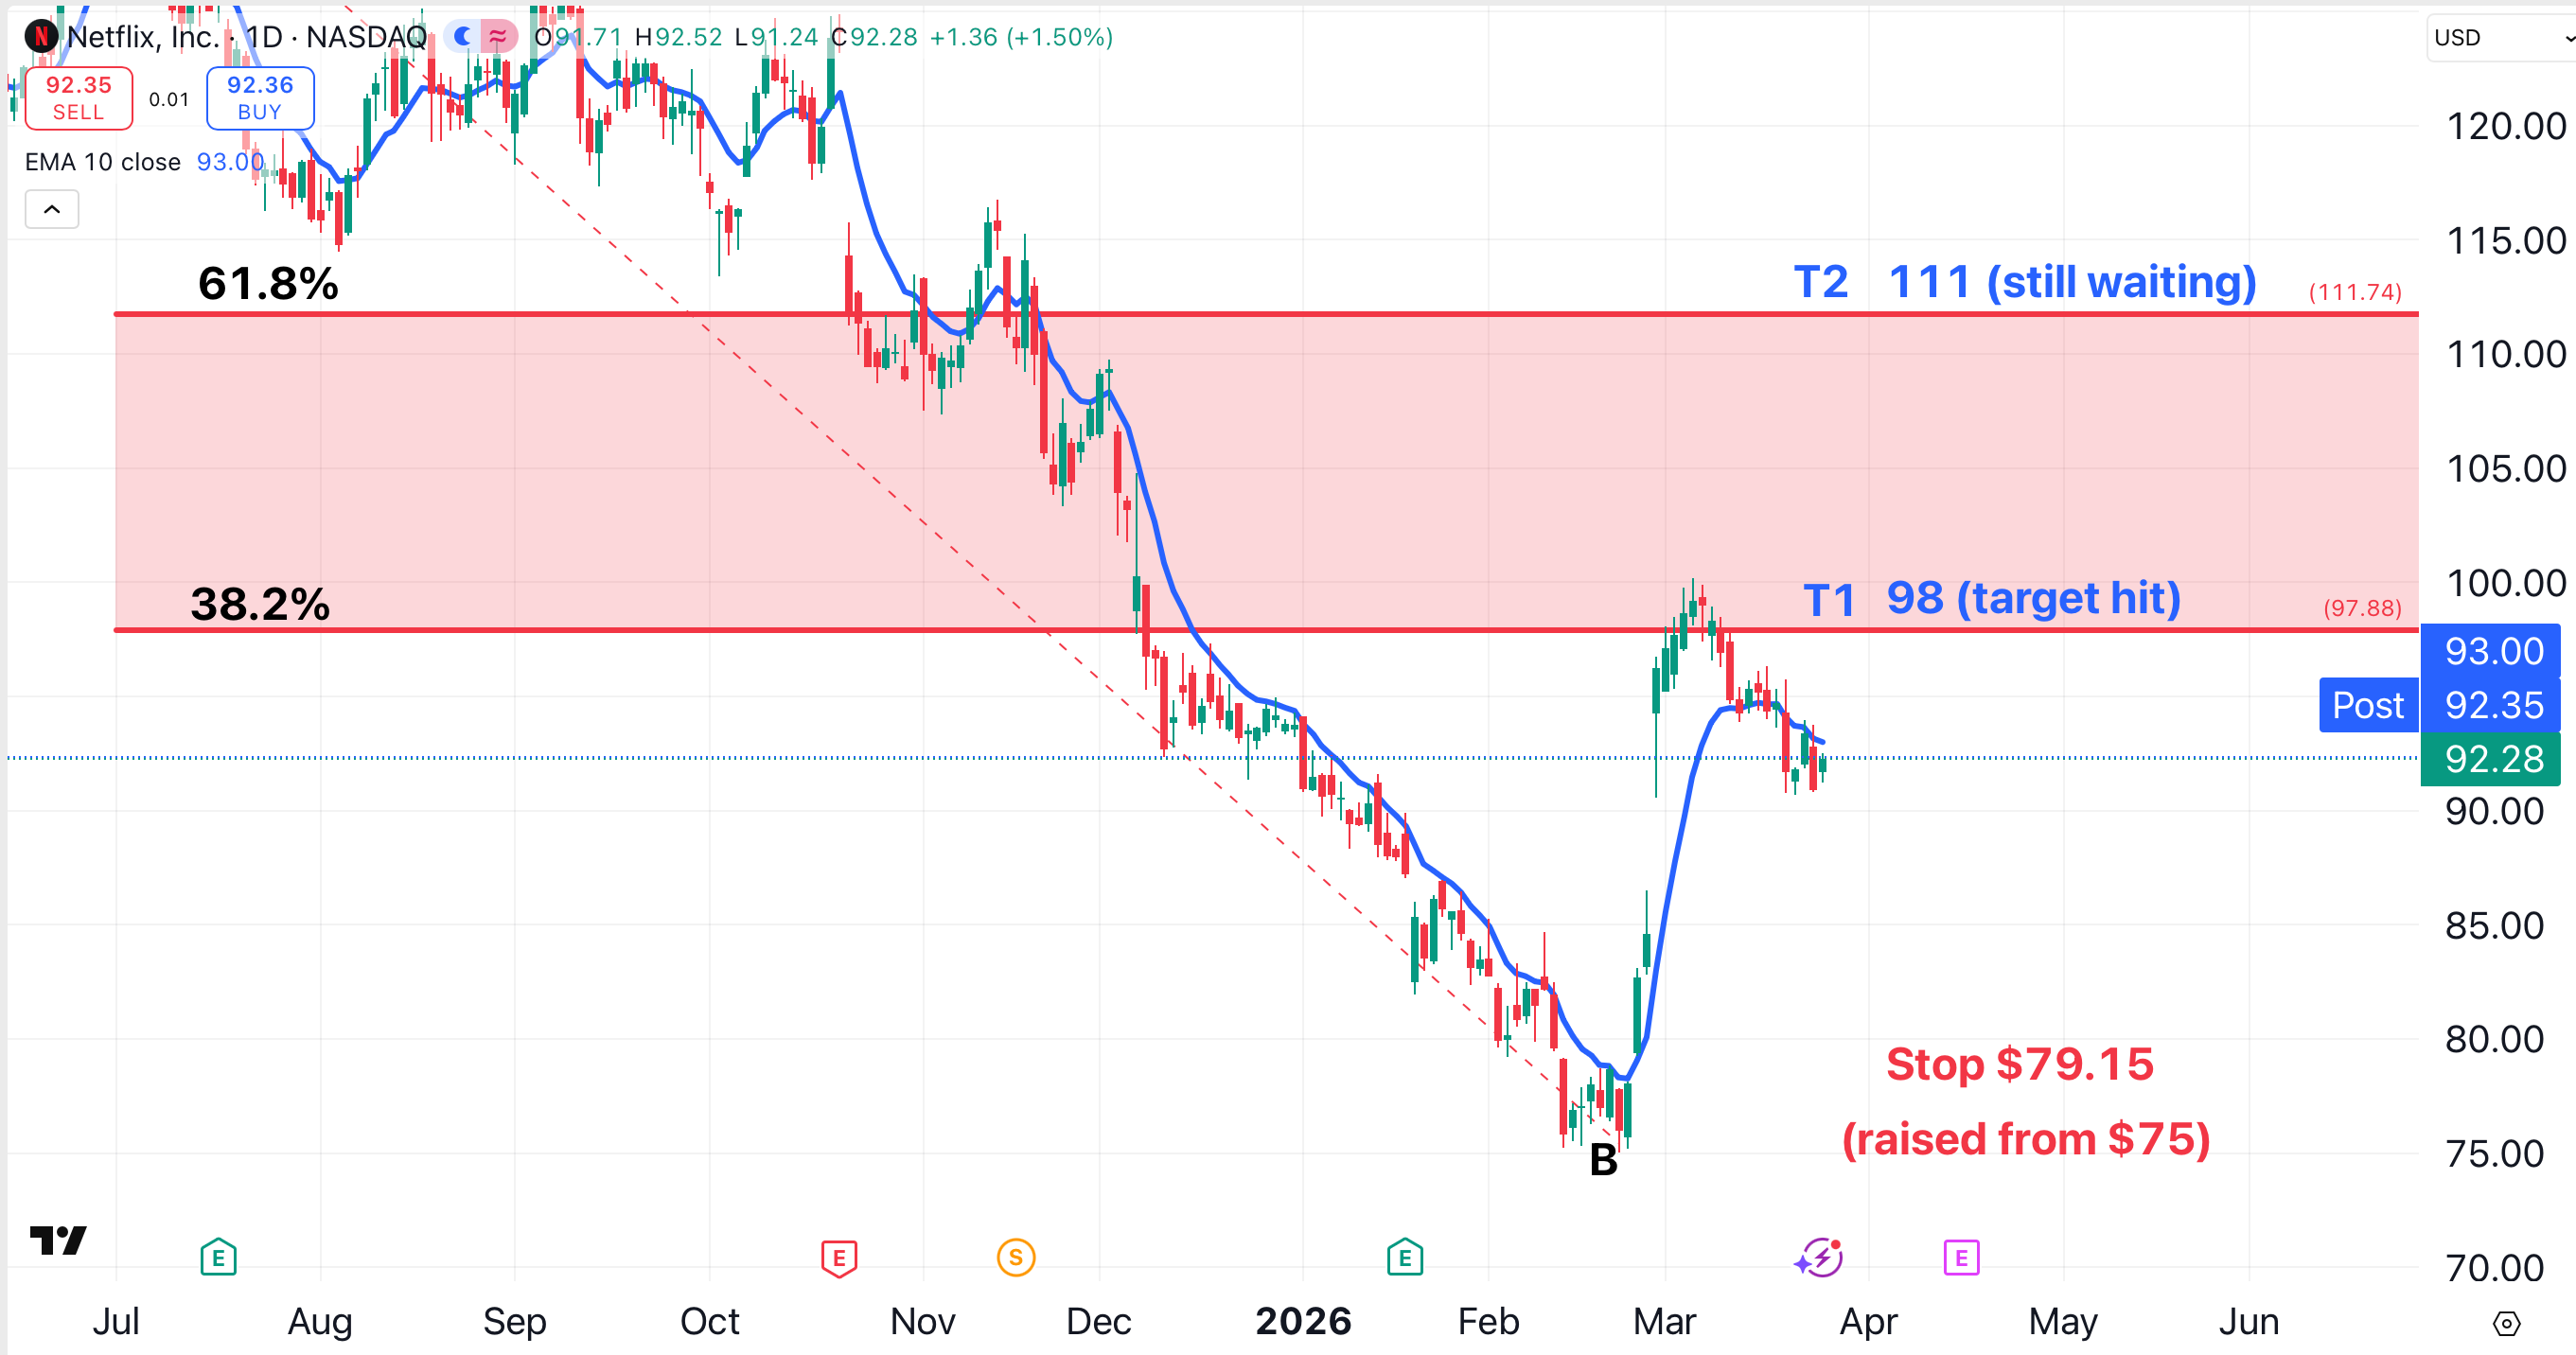
For example, last month we bought some Netflix (NFLX) as its deal with Warner Brothers Discovery (WBD) was falling apart. We used a Fibonacci retracement to create two targets (T1 = $98 and T2 = $111), and placed a stop at $75.
You can see that plan here.
A few days later, we updated the plan, locking in a profit on half of the position at $98 (T1) and raising the stop to $79.15.
Here is a current chart:
Am I stressing out over what might happen next? Not at all. I know that I can’t control the market, so I try not to worry about things I can’t control.
I’m already halfway out of the position, as T1 has already been hit at $98. This takes half the weight off of my shoulders.
I’ve already tightened the stop. I may tighten it further. That’s about the only variable remaining.
It’s a simple plan. Better than a complex plan in my opinion, and much better than no plan at all.
Bottom Line
Planning trades and managing risk can ease the stress generated by market volatility. In turn, lower stress leads to a clearer head, which should lead to better decision-making. We all have the ability to create trading plans and manage risk.
Related: Emerging Market Selloff Shows Flashes of 2008 Financial Crisis
At the time of publication, Ponsi was long NFLX and AUDUSD.
