Earny Asks: Is the Trend My Friend?
Let's learn how to determine the trend of an investment.
You've reached your free article limit
You've read 0 of 1 free Pro articles.
Recently, I stepped away from my desk to go on a walk. A long walk. Some of you may be familiar with the Camino de Santiago, a hike that goes through northern Spain, which many people take as a religious pilgrimage. For me, it wasn’t about religion. It was a chance to unplug from daily life and see the Spanish countryside. It was refreshing.
The route is easy to follow. Markers lead the way, containing yellow seashell and arrow markings.

This got me thinking, how nice it would be if investors had similar markings. A yellow arrow pointing in the direction that my investment might be headed. There’s nothing like this for investors. I mean, some people will tell you that there is, but there isn’t. There is no road map.
However, there are tools that you can use to understand where a stock might be headed. And today’s Earny Asks will dive into it.
Earny Asks, How Do I Know if My Stocks Are Headed Higher or Lower?
There are two main branches of stock market analysis. On the one side, you’ve got the fundamental analysis. This method digs into the company’s business prospects and tries to understand things like earnings growth and how much the company is worth. If a fundamental analyst can buy the company’s shares for less than they think the company is worth, they’ll do it.
The thing about fundamental analysis is that it’s really hard! It requires not only knowledge of how to analyze a company’s data, but also the access to that data. TheStreet Pro’s Stephen “Sarge” Guilfoyle often provides an in depth analysis of a company’s fundamentals based on his many years of experience. See his analysis of Microsoft (MSFT) here.
The other main branch of stock market analysis is technical analysis. This method analyzes the supply and demand for the company’s shares. In other words, if buyers of the stock are more aggressive than sellers of the stock, then the stock will rise in price.
Technical analysts measure whether buyers or sellers are more aggressive using various tools, and then predict whether that same group will continue to be aggressive or not.
There Are 4 Categories of Tools Used by Technical Analysts:
- Trend
- Momentum
- Volume
- Volatility
Measuring Trend
Let's focus on trend today. You might consider trend to be like the yellow arrows that I saw on the Camino.
Think of trend as the direction that a stock’s price is going in. That direction can be up, down, or sideways.
How Do We Measure It?
This is the chart of a stock. I’ve removed most of the details except for the price line. As you can see, the stock goes up, then down, then up again, and then sideways.
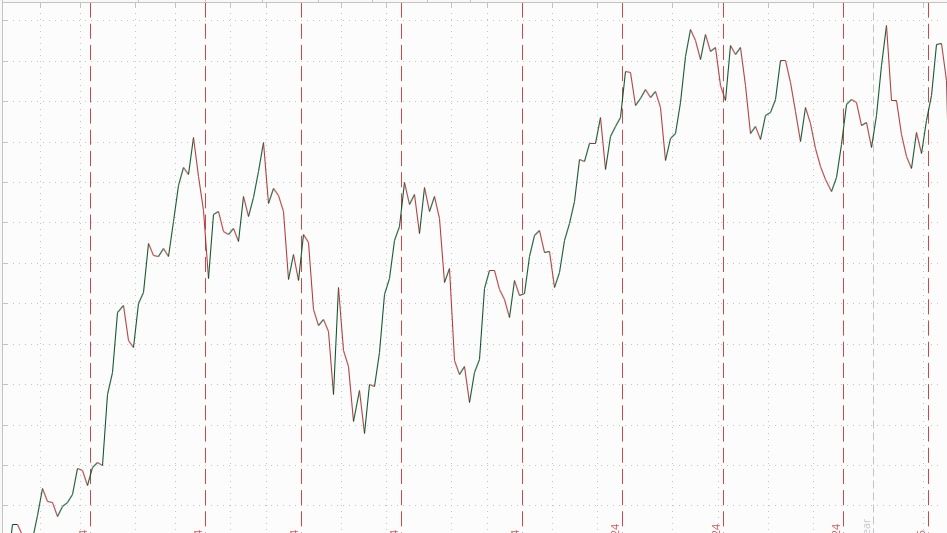
Maybe you see it. But maybe you don’t. We can add rules to make the analysis more obvious.
Notice that within the wiggles of this chart, there are highs and lows, like stair steps. An uptrend is when those stair steps are increasing. A downtrend is when they’re decreasing. And we can mark each of those little highs and lows, the stairs, so we can track them.
In this version of that same chart, I’ve done just that. When the highs are getting higher and the lows are, too, that’s an uptrend. See how I’ve labeled the uptrends in green? Those little highs and lows are increasing.
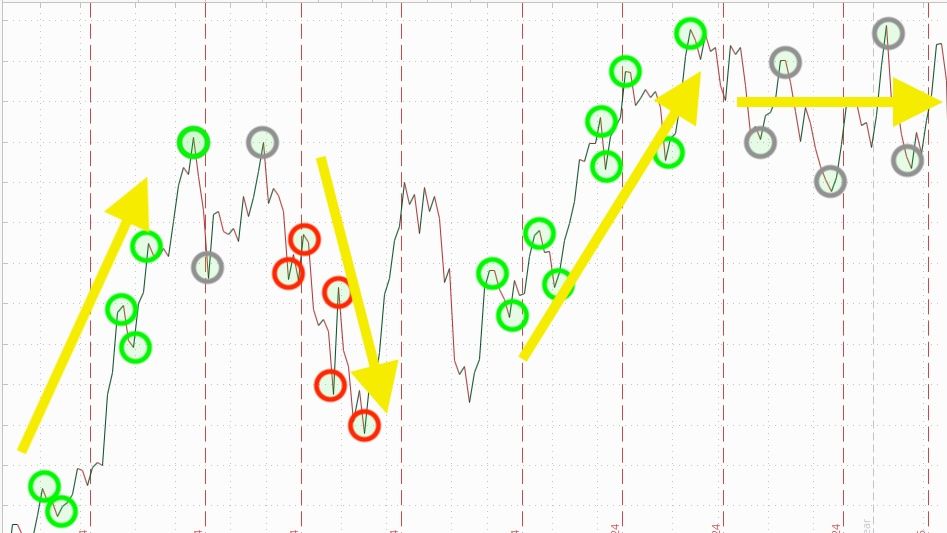
In the downtrend, those little highs and lows are decreasing. The downtrend is shown in red and each of those little circles highlighting the little highs and lows seems to be falling.
In the sideways trend over on the right side of the chart, the highs are increasing a little bit but the lows aren’t. There’s no real trend, as the stock trades sideways.
Analyzing the Trend of Gold
Let’s use our golden trending arrows on a chart of gold using the iShares Gold Trust ETF (IAU) .
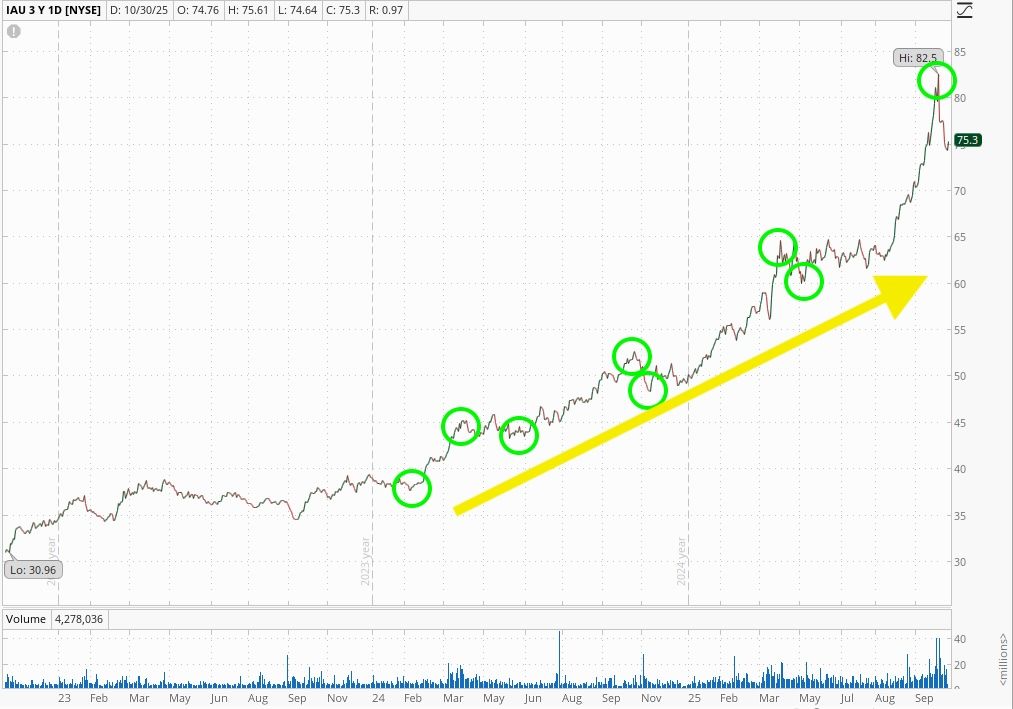
In the three years covered by this chart, gold has had a fabulous run. It’s been up as much as 166%. Notice the green circles. They’re highlighting those mid-trend highs and lows that define the uptrend, leading to the recent high of $82.50.
More recently, gold has fallen by around 10%. If you’re sharp eyed, you’ll notice a little zig-zag downtrend on the far right side of the chart that looks like a falling staircase. That’s something to keep an eye on.
What does this mean for gold? Well, if you’re a trader, gold is falling in the short-term. For longer-term investors, gold remains in an uptrend until it falls below around $60, where the prior low was. If gold gets down to that point, you might even expect a bounce. But that would be a big drop that could indicate a real change from this bullish sentiment that’s driven gold up so strongly.
Final Thoughts
How does trend help you as an investor?
It’s about as much of a road map as we get in investing. Like the arrows on the Camino, telling me which way to walk, trend helps investors to understand whether other investors are buying or selling their shares. If they’re buying, those mid-trend highs and lows will be rising and there’s a good chance that they’ll continue to do so. If they’re selling, those mid-trend highs and lows will be falling and, perhaps, they’ll get to a level where the stock is worth buying.
There’s a saying among investors that the trend is your friend. In the future, we’ll cover the second half of that saying, which is, “except at the ends, where it bends.” That’s the key to technical analysis. You should understand the trend, but also be on the lookout for signs that it may come to an end.
