Boockvar Sums Up the Week’s Events
From Peter Boockvar:
Positives,
1) It’s a good thing that the two biggest economies are getting along.
2) While rising for both, though still remaining low, initial jobless claims totaled 211k, 6k above expectations and up from 199k last week. The 4 week average moved up a hair to 204k from 203k. Continuing claims rose to 1.782mm from 1.758mm.
3) Nominally, core retail sales in April rose .5% m/o/m and that was one tenth above the estimate and follows an .8% gain in March (revised up by one tenth) . Headline CPI btw was up .6% m/o/m after a .9% gain in March.
4) Helped by the pull forward of ordering, the May NY manufacturing index rose to 19.6 from 11 and above the estimate of 7.2. New orders rose to the highest since December 2022. Prices paid though rose 11.6 pts to the highest level since July 2022. Prices received were up 10 pts to the most since August 2022. The 6 month business outlook was 33.5 which compares with the 6 month average of 30.4. Capital spending plans at 15.5 is 1.2 pts above its half yr average, up slightly m/o/m.
5) April US industrial production rose .7% m/o/m with help from manufacturing which was up .6%. GenAI is helping of course with increases in computer/electronics and electrical equipment along with machinery. Aerospace too did well. Auto production rebounded after March weakness.
6) From Viking Holdings: “we are already 92% booked for 2026, which positions us very well for the remainder of the year. With 2026 mostly booked, our sales and marketing focus has shifted towards 2027, which has great momentum. The season is already 38% booked, with the capacity for our core product increasing by 15% over 2026…Historically, when geopolitical events occur, we have seen a short-term softening in bookings as our guests take time to process the new developments. After the last earnings call, we experienced a temporary slowdown, mostly in river bookings, for the 2026 season. Demand has since rebounded, reflecting that travel remains a priority for our customers.”
7) From Klarna: “Turning to credit quality, consumer delinquency rates remain healthy across both product lines…In Pay Later, our charge card equivalent product and our largest by volume, 30 day plus delinquency rates are stable and well managed. This is a short duration, high frequency book…people use us for everyday spending needs, as well as for large ticket and medium sized ticket.”
8) From YETI: “we’ve entered the 2nd quarter with global demand trends showing strength, continuing momentum from the last two quarters…In this quarter, we saw broad based strength across categories and channels…Across our core product platforms of drinkware and coolers equipment, performance was driven by the right assortment, augmented by innovation, and amplified by our omni-channel model…Demand remained strong across wholesale, e-commerce, Amazon, and retail, partially offset by softness in corporate sales.” International sales were good too but also down in corporate sales.
9) From Applied Materials: “The momentum in our business is being driven by three key factors. First, the rapid global build-out of AI computing infrastructure. Second, Applied’s leadership positions in the most enabling and highest value areas of the market, particularly leading edge foundry, logic, DRAM, and advanced packaging. And third, strong execution across our operations and supply chain.”
10) From Cisco: “Product orders from service provider and cloud customers accelerated in Q3, growing 105% y/o/y, with five of the top hyperscalers each growing in triple digits. We also saw solid growth from telco customers in Q3, with orders up 9%. Telcos are investing in Cisco technology as they prepare their networks to handle the scale, speed, and complexity of AI.”
Negatives,
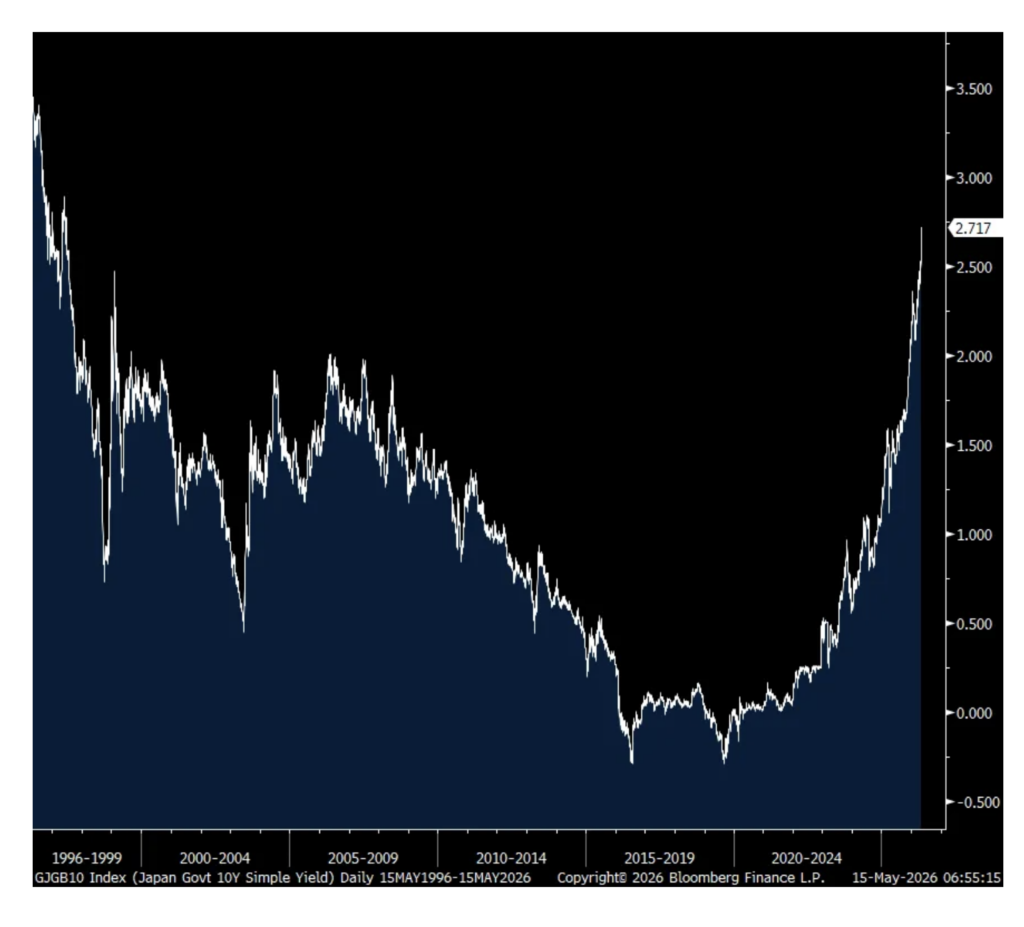
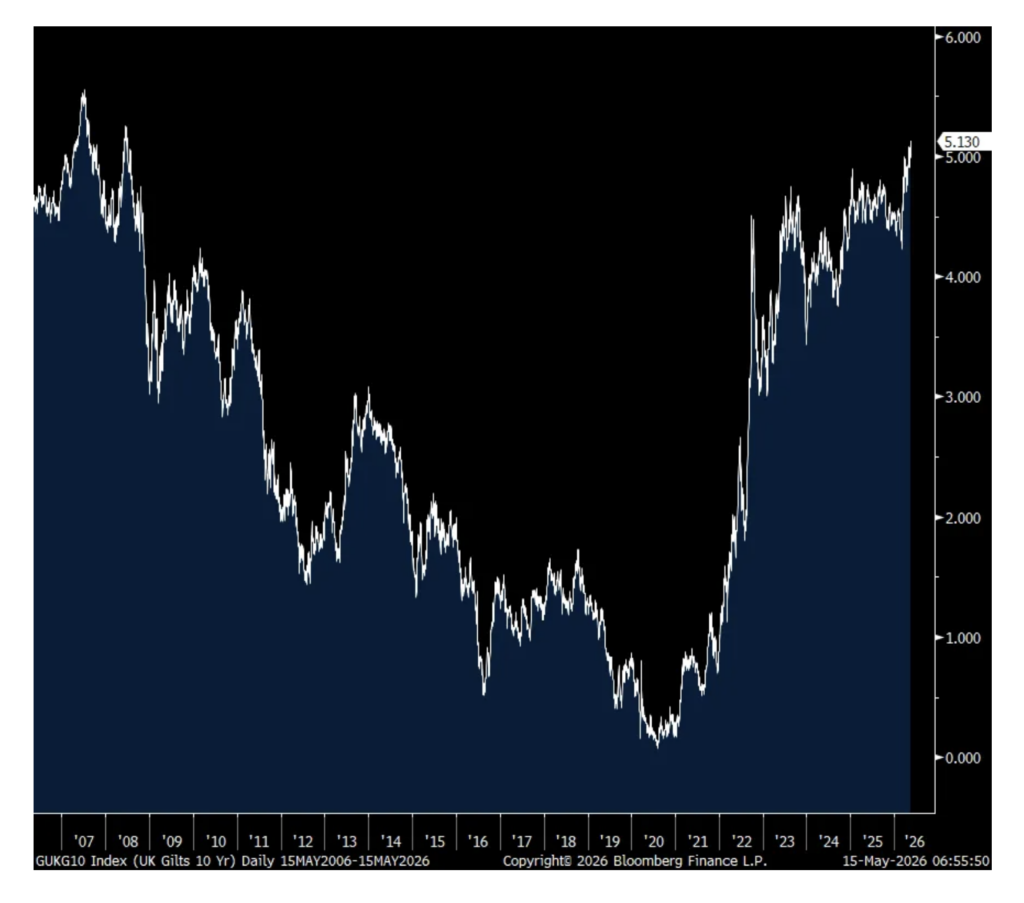
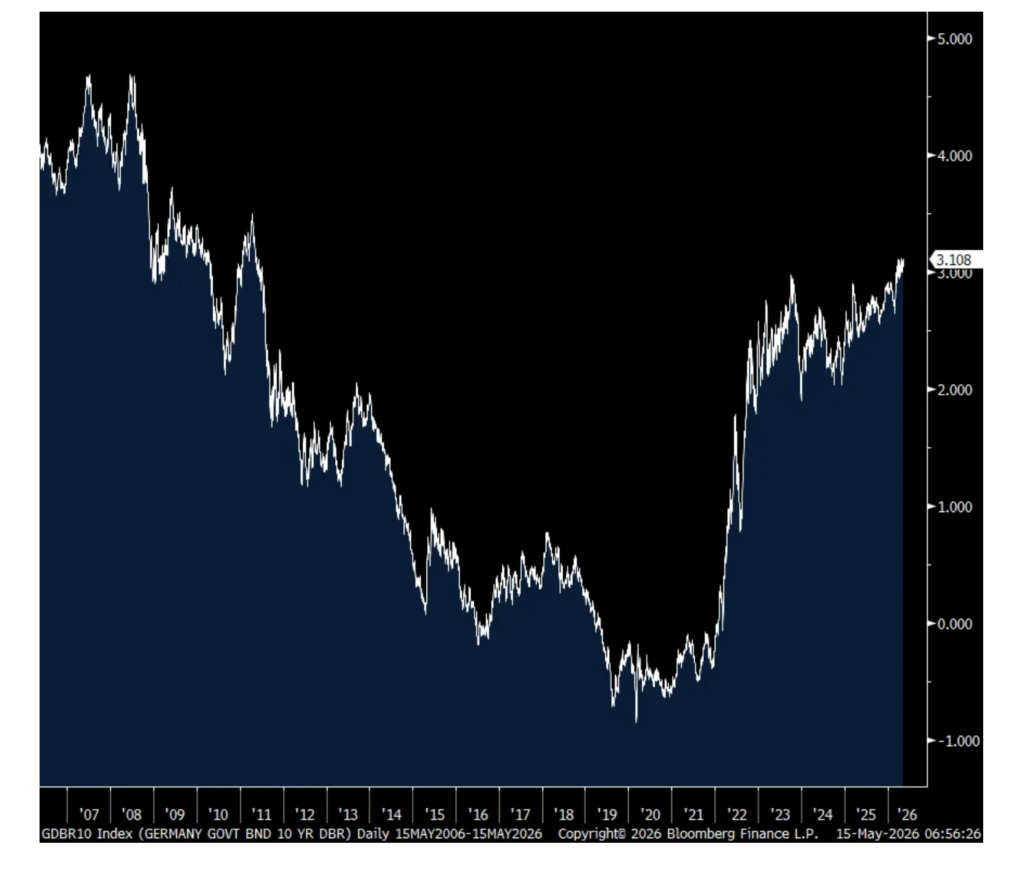
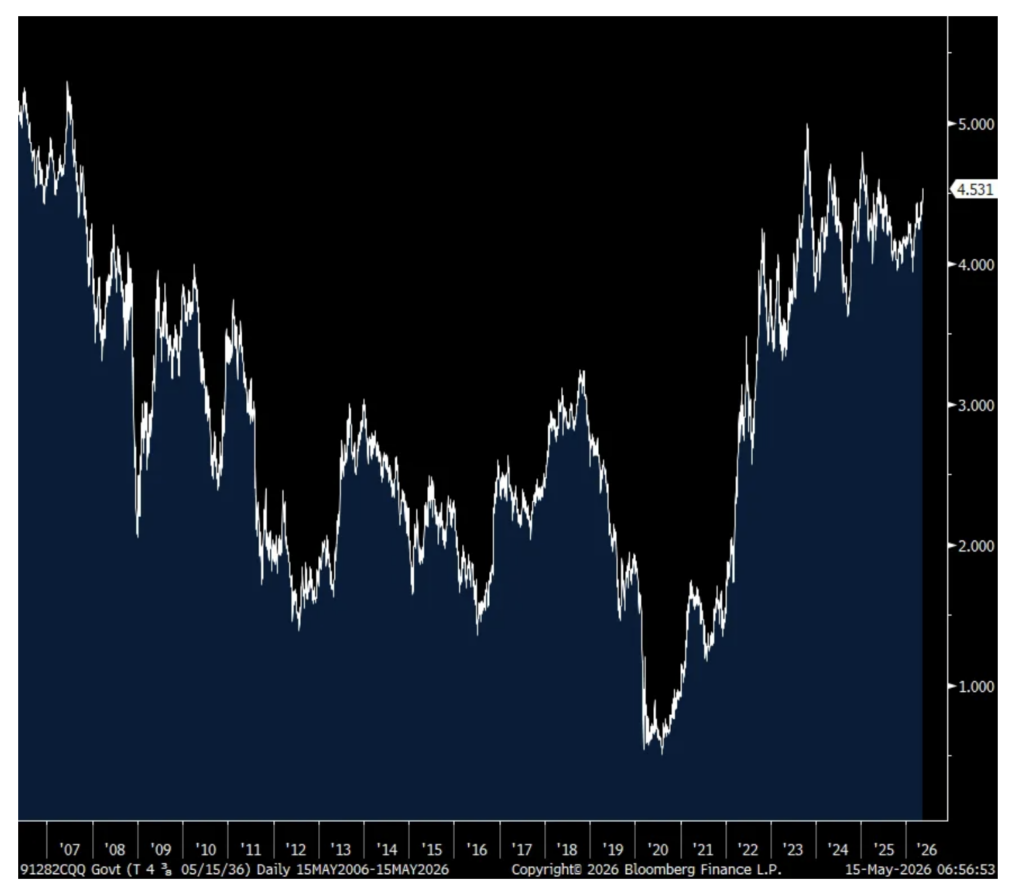
1) The global rise in longer term interest rates continues and it’s finally getting some notice.
2) The April CPI rose .6% m/o/m headline as expected while the core rate was higher by .4% m/o/m, one tenth above the estimate. Versus last year, CPI was up 3.8% headline and 2.8% core vs 3.3% and 2.6% in the month before. Energy prices jumped 3.8% m/o/m after the 11% rise in March and 18% y/o/y for obvious reasons with gasoline mostly driving that. Electricity prices jumped by 2.1% in the month alone and up by 6.1% y/o/y and we assume data center power demand as the key factor. Food prices bounced by .5% m/o/m and now by 3.1% y/o/y, if we include beverages too. Food at home prices were up by .7% m/o/m and 2.9% y/o/y. Helping to drive this was the 1.8% m/o/m and 6.1% y/o/y rise in fruits and vegetables (see my previous note and comment from Fresh Del Monte) . Also, beef/veal prices spiked by another 2.7% in April and higher by 15% y/o/y. For those costs away from home, prices were up .2% m/o/m and 3.6% y/o/y. Services inflation ex energy was up .5% m/o/m and 3.3% y/o/y. Goods prices were unchanged m/o/m and higher by 1.1% y/o/y.
3) April PPI jumped by 1.4% m/o/m headline, about 3 times what was expected (.5%) , while the core was higher by 1% m/o/m, also well above the estimate of up .3%. Both follows gains of .7% and .2% for each in the month before (revised up from .5% and .1%) . This brings the y/o/y gain to 6% and a core rate of 5.2%. Taking out food and energy saw a .7% m/o/m increase and by 4.6% y/o/y so this is more than just fuel and food prices. With respect to services, prices were up 1.2% in the month and by 5.5% y/o/y.
4) Import prices were higher than expected, jumping 1.9% m/o/m vs the estimate of up 1%. The y/o/y increase shifts up to 4.2% from 2.3%. Even taking out food and energy prices, import prices were up by .7% m/o/m and 3.3% y/o/y.
5) Existing home sales in April at 4.02mm continues to bounce around 30 yr lows. Home prices rose .9% y/o/y.
6) The April NFIB Small Business Optimism index was little changed at 95.9 vs 95.8 in March, hanging around a one year low. The NFIB’s bottom line, “Inflationary pressures continue to be a challenge for Main Street.”
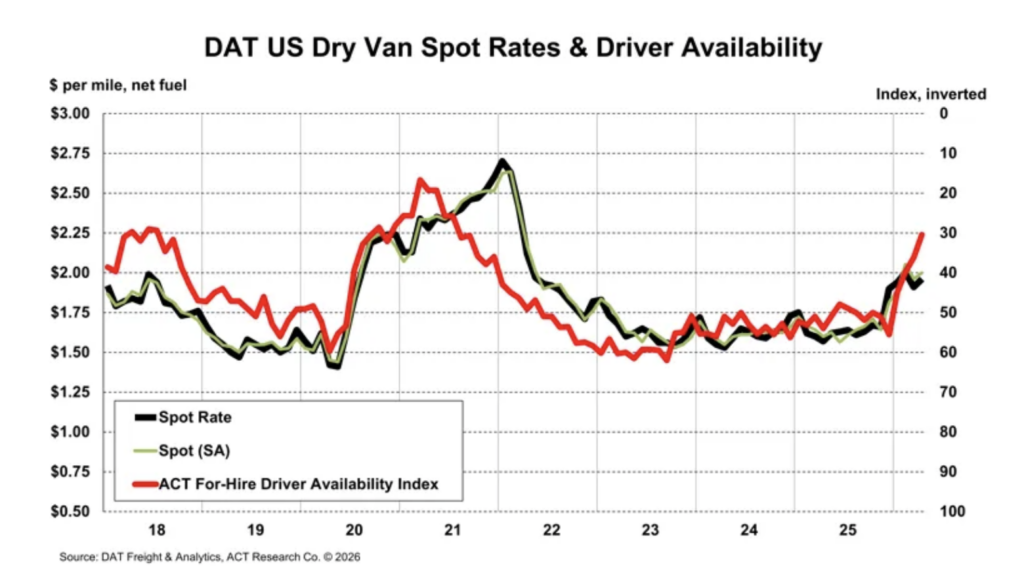
7) In the April Cass Freight shipments report which showed a .6% m/o/m increase but 4.4% y/o/y decline, this was a good summary of the state of the trucking industry, with an emphasis of higher prices: “A supply-driven freight cycle doesn’t imply strong volumes, and with higher fuel prices sapping consumer spending, and rising interest rates sapping the housing market, this time is no different. Improving survey data, including a jump in the ACT For-Hire Volume Index, suggest our friends at medium and large dry van and reefer fleets are beginning to see significantly stronger demand, even as the broader market does not. The source of this early demand increase is primarily capacity reduction, which has accelerated this year due to an incipient driver shortage…While the goods economy is providing little lift, the key question becomes, how bad will the driver situation get? In a word, worse. Truckload spot rates have risen materially in recent months as the ACT For-Hire Driver Availability Index has declined. This index was above 50, meaning a surfeit, rather than a shortage, from June 2022 to December 2025, 43 straight months. It fell to 30.4 in April. New FMCSA regulations have acted as a catalyst, and seem likely to result in tighter capacity and higher rates from here.”
8) Container prices broke out to the upside after a slow creep up over the past few months. The Shanghai to LA route saw container prices rise to the highest since July 2025 at $3,357 per container, up 10% w/o/w. That price though while double its pre Covid price, is still well below the jumps we’ve seen since then. The Shanghai to NY price popped by 14% w/o/w to $4,252.
9) The Baltic Dry Index is at the highest level since December 2023.
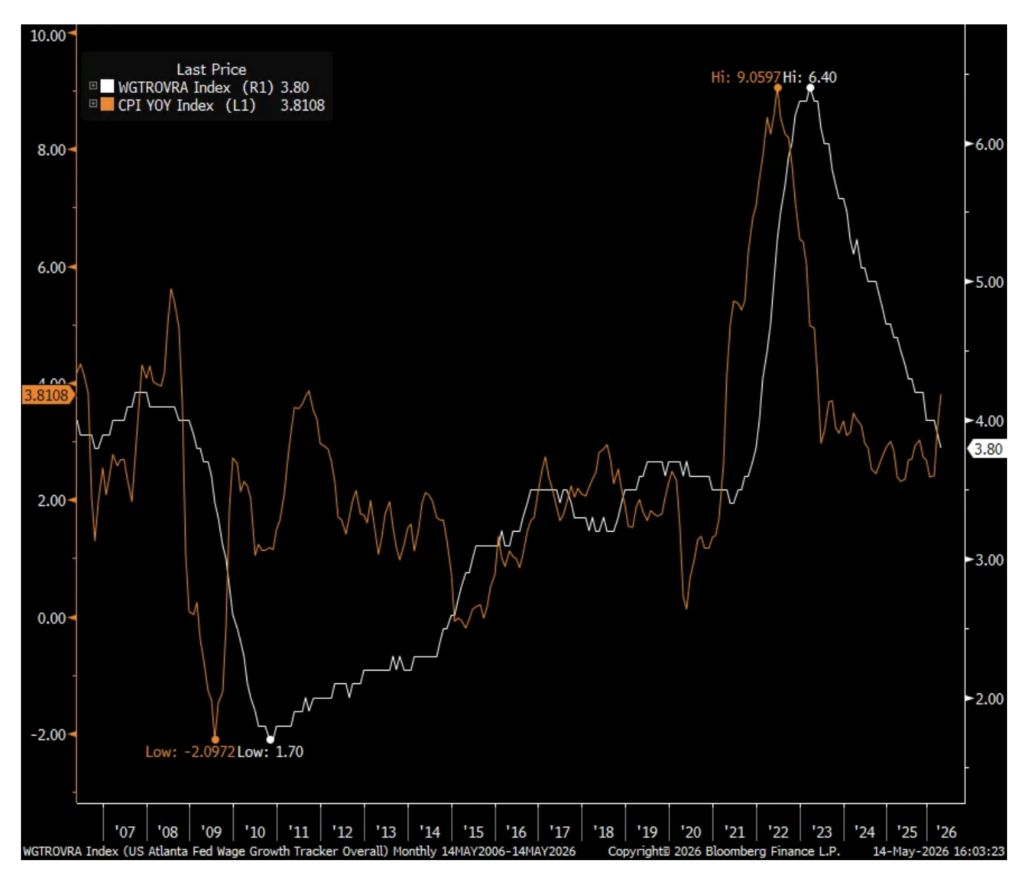
10) The Atlanta Fed April Wage Growth Tracker rose 3.8% y/o/y from 3.9% in March. Not much of a change but under the hood, pay for ‘job switchers’ grew by 3.8% y/o/y, down from 5% in March and 4.7% in the two months before that. For ‘job stayers’, pay rose 3.6% y/o/y vs 3.8% in March and 3.6% in February. Bottom line, inflation is back higher at the same time wage growth is slowing and putting a further squeeze on the consumer.
11) The Baker Hughes crude oil rig count was up just 2 rigs to 410 vs 407 at the end of February.
12) From ZipRecruiter: “The CEO referred to “a sluggish hiring backdrop. In Q1, the quits rate and total hires stayed near their lowest levels since 2015, while job openings were down 3% y/o/y.” Revenues fell 2% y/o/y and 4% q/o/q. “The y/o/y decrease was driven by a soft hiring environment, while the sequential decline reflects post holiday seasonality…We’re in a subdued but relatively stable environment and that captures the mood of employers on both sides of the marketplace.”
13) From Hapag-Lloyd: With respect to the Middle East, “I think the thing which is a little bit special about that is while the conflict itself is geographically quite isolated and as such does not impact global flows all that much, the effect it has on costs, of course, have a global effect because with the surge of energy prices, we have seen significantly higher costs hitting us. I think if we look at what we have today, then we definitely look at $50, $60 million extra costs every week…Of course, we try to pass that on, similar to when you go to the petrol station and you also have to a higher fuel price, but clearly that puts pressure on our business. As far as the militia is concerned, we still have a number of ships stuck there and we cannot go in and out of the Strait at this moment in time.”
14) From Mosaic: “Compressed margins and limited raw material availability have forced producers to curb production. For example, China has banned phosphate exports through August, and other competitors have significantly curtailed production primarily due to sulfur availability. To put it simply, there is not going to be enough phosphate to meet global demand.”
15) From Fresh Del Monte: “The conflict in the Middle East has introduced a meaningful shock across key inputs fundamental to food production, energy, fertilizers, packaging and transportation. There is no part of agriculture that is not energy dependent, from inputs to packaging to transportation. As a result, movements and energy costs do not remain isolated. They cascade through the entire system…Agriculture does not operate in real-time. The timing of impact varies meaningfully by category. In crops like pineapples, for instance, where production cycles extend to approximately 18 months, the impulse being deployed today will be reflected in cost and pricing later this year. Bananas, by contrast, move more quickly through the system and therefore, respond more immediately to changes in input costs.”
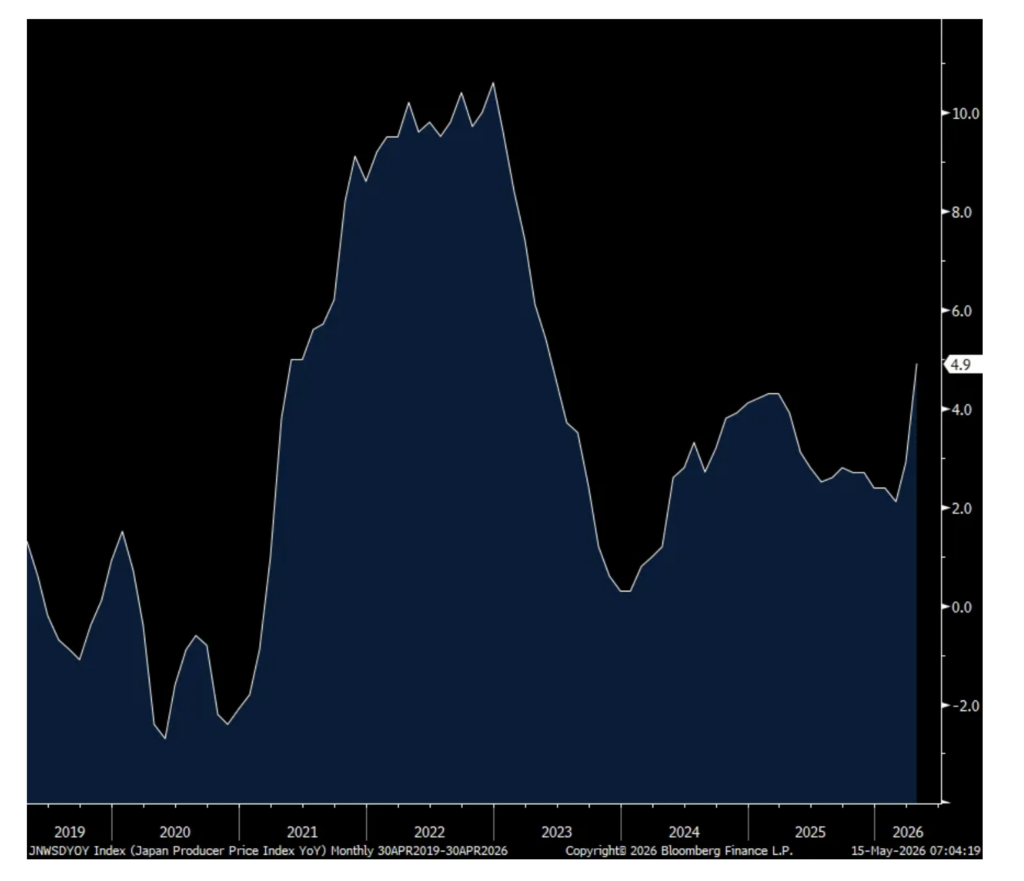
16) The Japanese April PPI spiked by 2.3% m/o/m, well more than the estimate of up .8% and the y/o/y gain is now 4.9% vs 2.9% in March.
17) For obvious commodity price reasons, April PPI rose 2.8% y/o/y, well above the estimate of up 1.8%. Consumer prices rose 1.2% y/o/y with the core rate up by the same amount.
Position: None
BY Doug Kass · May 15, 2026, 2:10 PM EDT