Monday’s After-Hours Advancers and Decliners
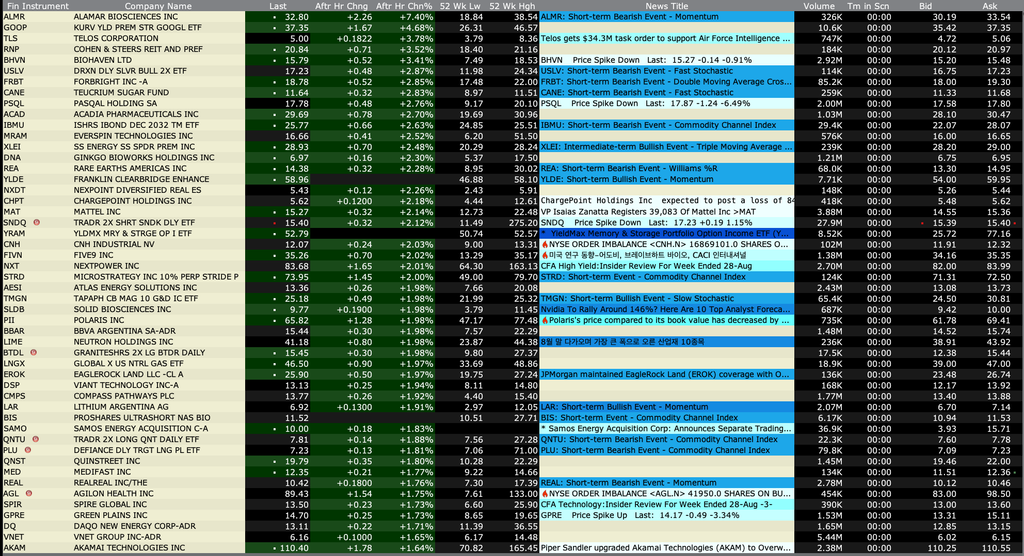
After-Hours % Advancers
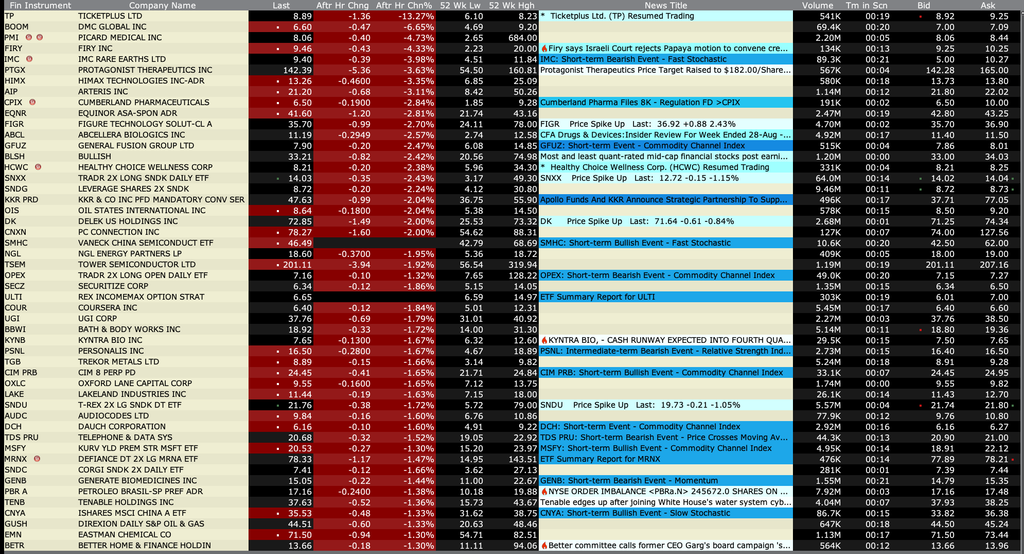
After-Hours % Decliners
Position: None
BY Doug Kass · Aug 31, 2026, 4:42 PM EDT
 Doug KassDoug Kass
After-Hours % Advancers
After-Hours % Decliners
Position: None
BY Doug Kass · Aug 31, 2026, 4:42 PM EDT
Closing Volume
– NYSE volume 8% below its one-month average
– NASDAQ volume 15% below its one-month average
– VIX index: up 3.19% to 14.89
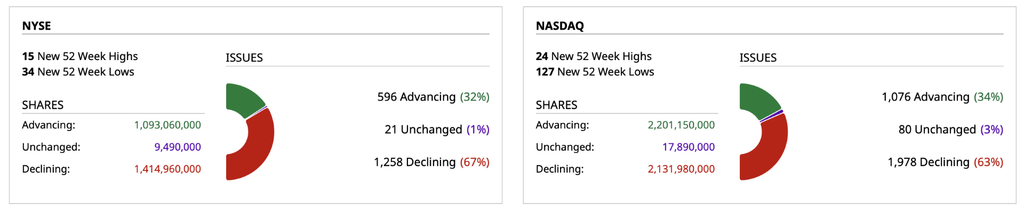
Breadth
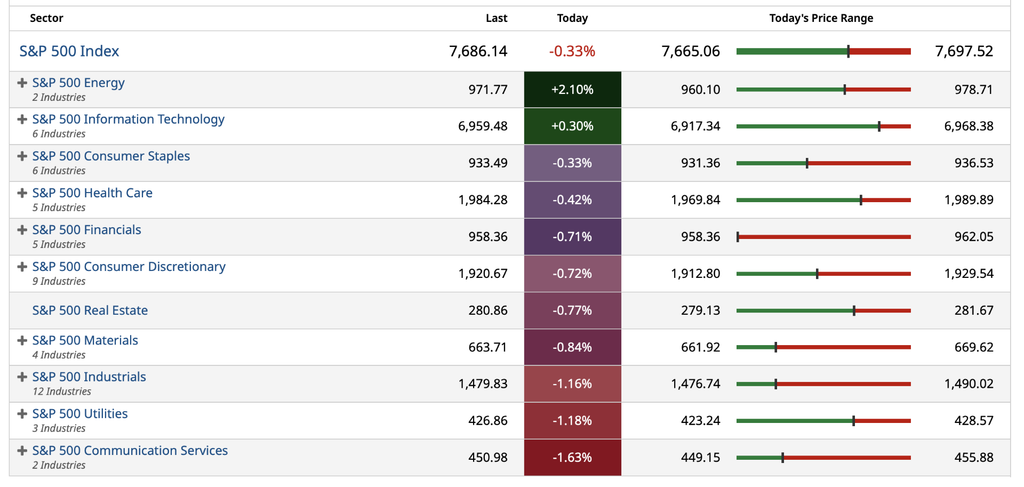
S&P 500 Sectors
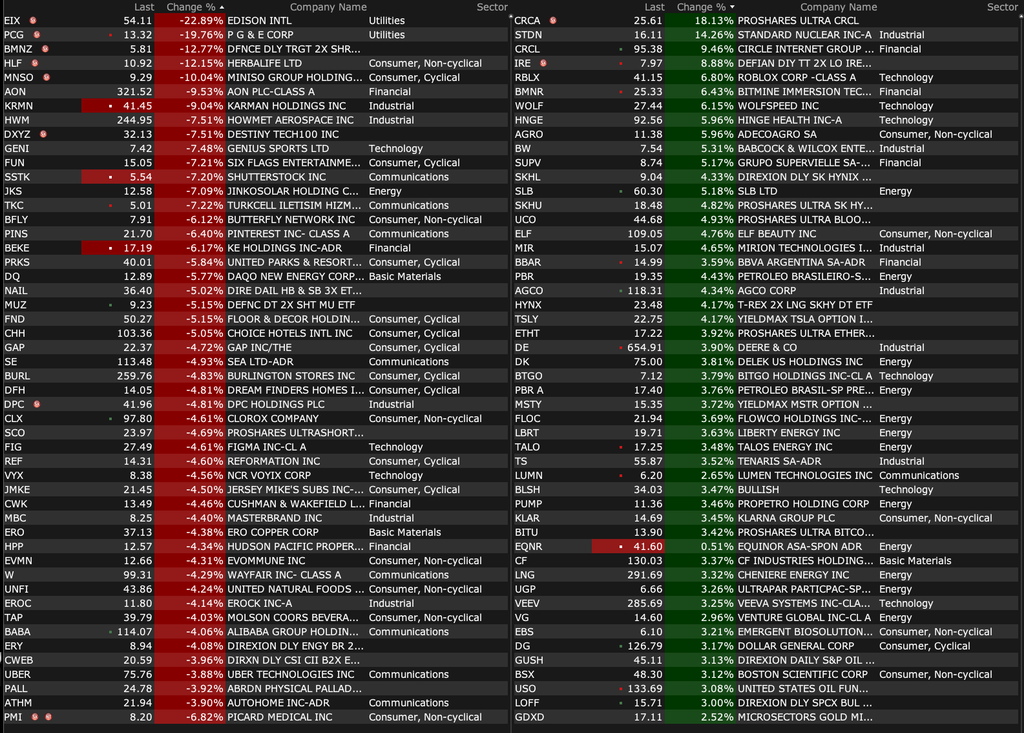
% Movers
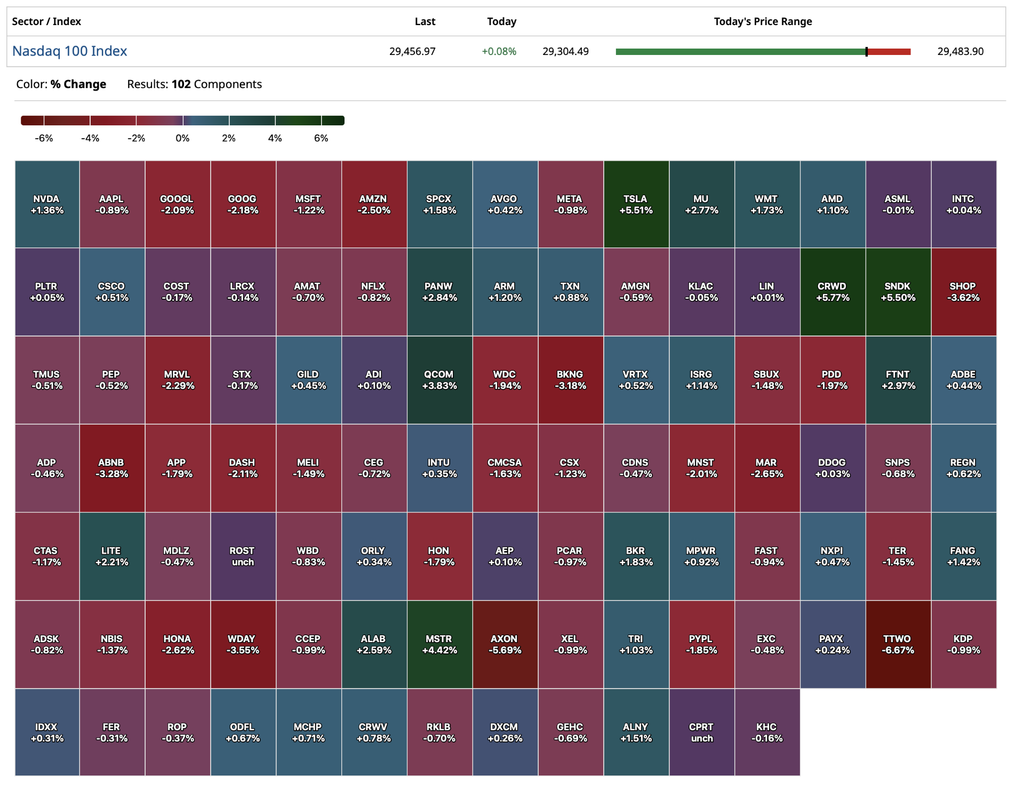
Nasdaq 100 Heat Map
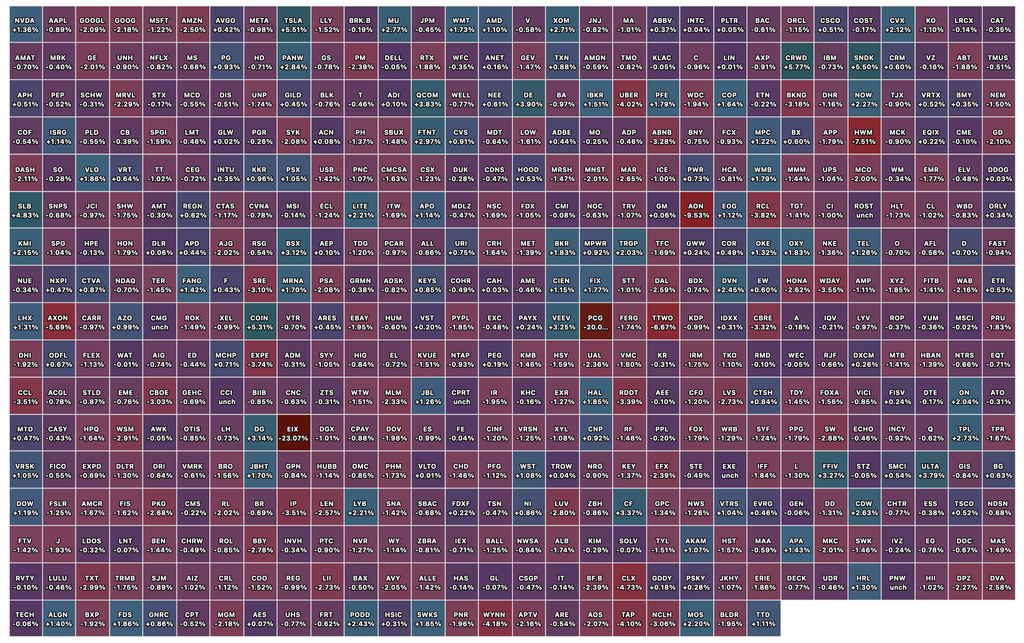
Closing S&P 500 Heat Map
Position: None
BY Doug Kass · Aug 31, 2026, 4:39 PM EDT
The last three weeks have been filled with far too much trauma and too many deaths.
Unfortunately, I just returned from the vet and this will be the last day of life for my beloved 17-year-old doxie, Ollie.
I have to go back to the vet shortly and put my precious boy down.
I won’t be returning to the office for the balance of the day.
See you all bright and early tomorrow morning.
Position: None
BY Doug Kass · Aug 31, 2026, 12:15 PM EDT
Still higher bond yields (and lower bond prices) coupled with another rise in the price of crude oil (+$2.30) may suggest that a vigorous end-of-the-day (and month) rally might be challenged.
Position: None
BY Doug Kass · Aug 31, 2026, 11:45 AM EDT
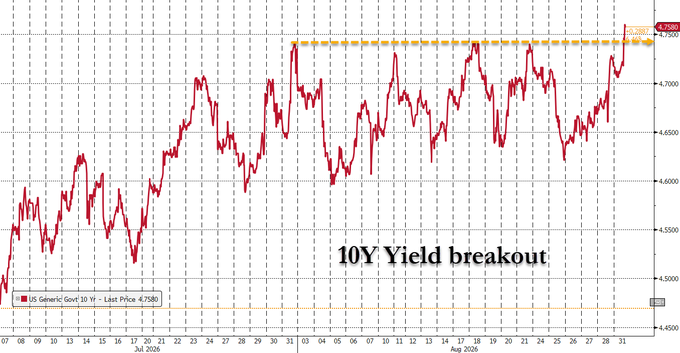
Source: ZeroHedge
BY Doug Kass · Aug 31, 2026, 11:30 AM EDT
Volume
– NYSE volume 12% below its one-month average
– NASDAQ volume 16% below its one-month average
– VIX index up 5.75% to 15.26
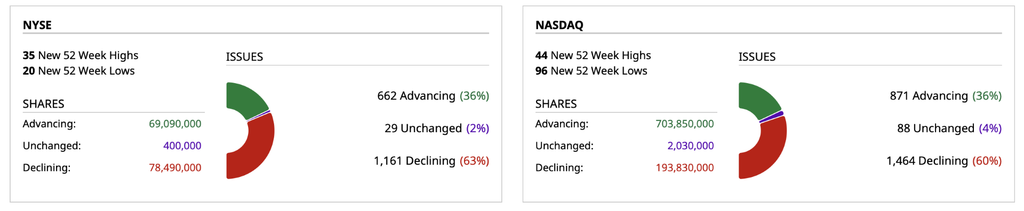
Breadth
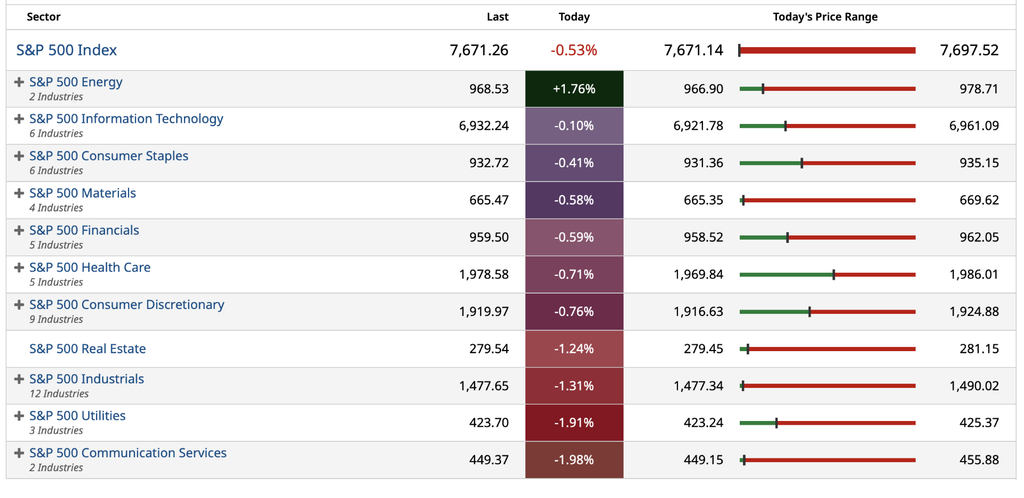
S&P 500 Sectors
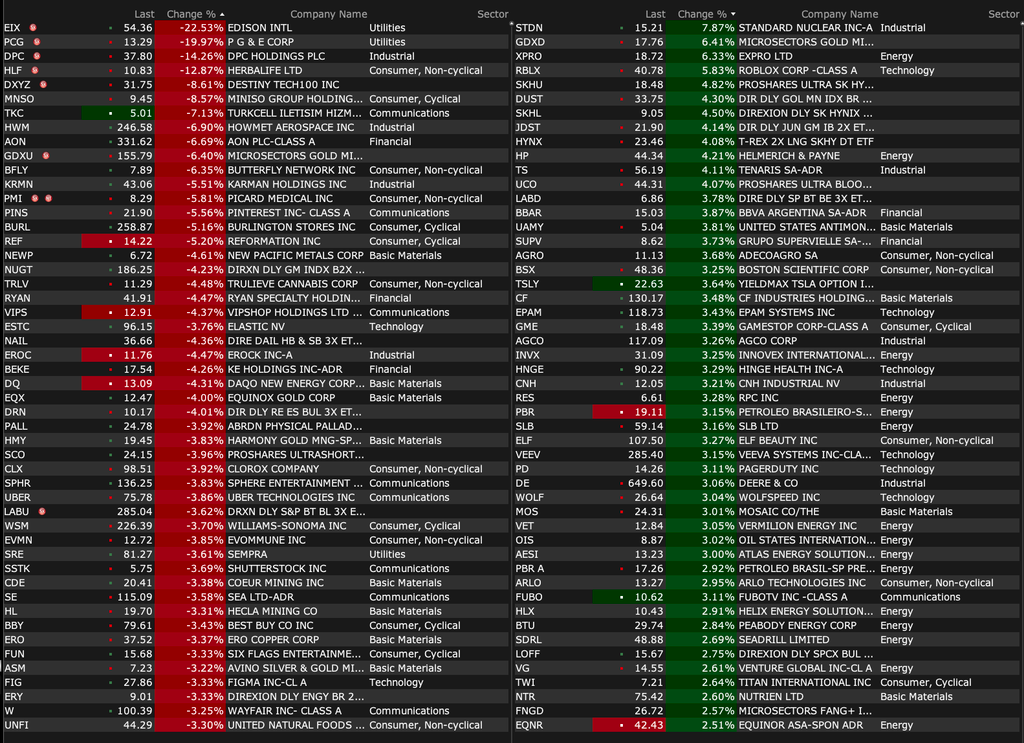
% Movers
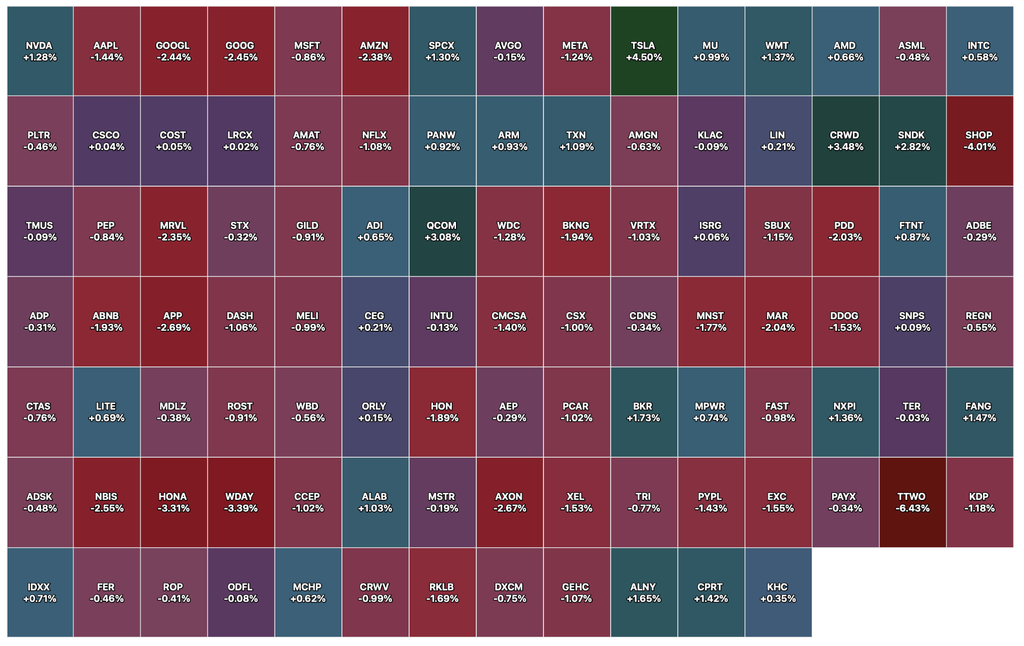
Nasdaq 100 Heat Map
Position: None
BY Doug Kass · Aug 31, 2026, 11:20 AM EDT
This is the third day in a row of bad breadth:
Position: None
BY Doug Kass · Aug 31, 2026, 11:05 AM EDT
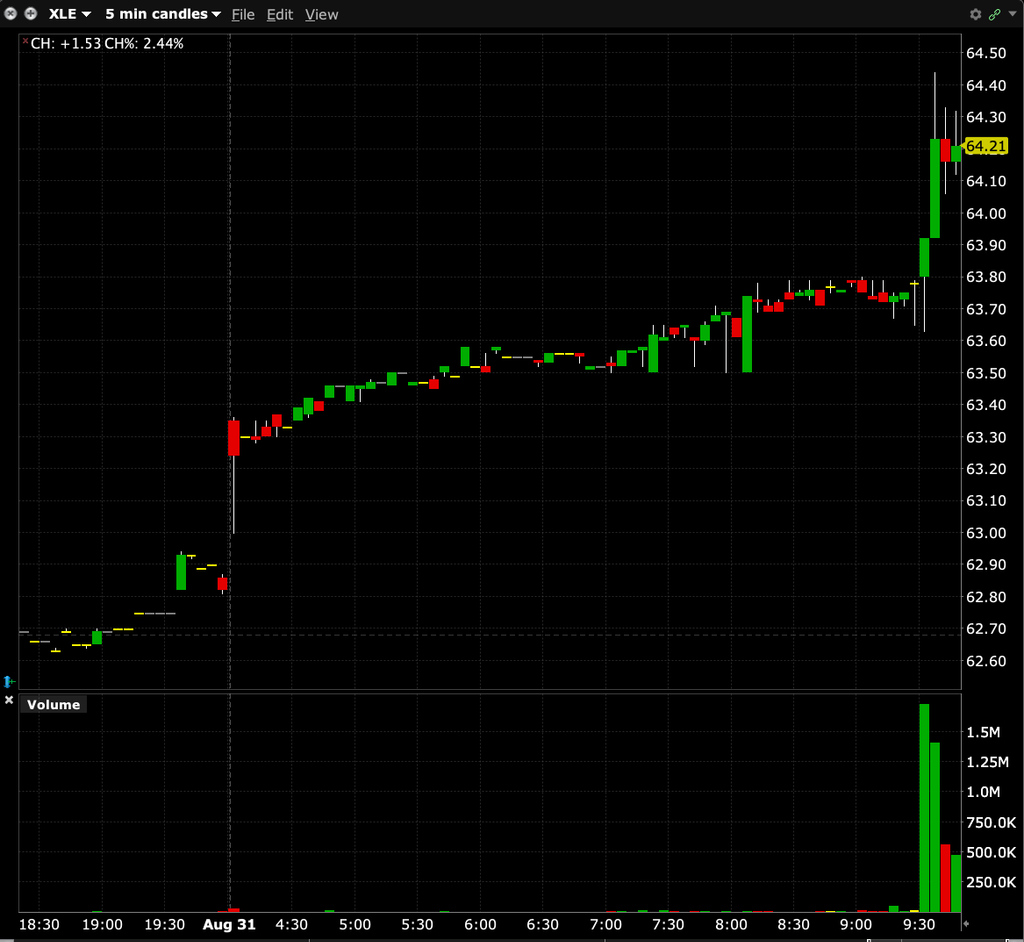
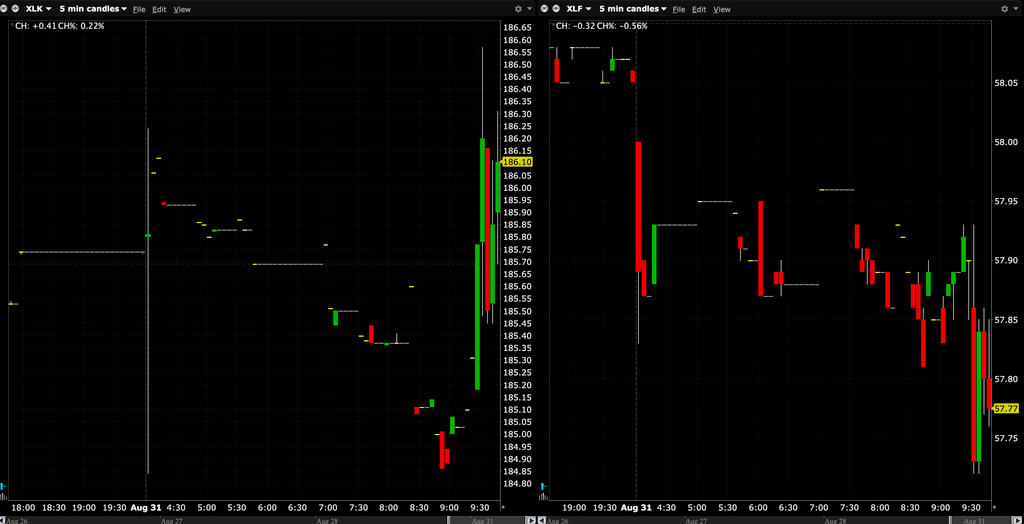
Charts from 9:49 a.m. ET
BY Doug Kass · Aug 31, 2026, 10:55 AM EDT
I expect aggressive markups this afternoon as it’s the last day of the month.
All things being equal I will aggressively short that move.
Note: I have no index shorts on right now.
Position: None
BY Doug Kass · Aug 31, 2026, 10:53 AM EDT
I am speculating on MSOS (MSOS) September monthly out of the money calls.
Positions: Long MSOS calls S common VL
BY Doug Kass · Aug 31, 2026, 10:24 AM EDT
* Buying gold
I have initiated a long in gold.
I purchased GLD (GLD) at $405.05.
I plan to average down on any weakness.
More early this week.
Positions: Long GLD VS
BY Doug Kass · Aug 31, 2026, 10:02 AM EDT
I added to my CRM (CRM) short at $258.95 this morning.
I am bidding for VRNO (VRNO) at $6.05 now.
Positions: Long VRNO S; short CRM S
BY Doug Kass · Aug 31, 2026, 10:00 AM EDT
Comment from “Meet” Bret Jensen:
Bret Jensen
28m ago
Why housing will remain moribund dept.
10 years ago: 30-yr mortgage rate was 3.4% & median existing home price in the US was $243k
Today: 30-yr mortgage rate is 6.7% & median existing home price is $434k
Result: $38k increase in down payment (assume 20% down) & 160% increase in monthly payment (from $862 to $2,240)
And now add in the big hikes in property taxes and insurance in many regions of the country.
Positions: None.
BY Doug Kass · Aug 31, 2026, 9:45 AM EDT
-MOVE +43% (expands critical IT capacity to 8 MW by end-2026; secures $33M private placement in step to fund expansion)
-SAIC +8.0% (earnings, guidance)
-GME +3.8% (Q2 guidance; amends $1.4B convertible notes exchange)
-BW +3.6% (Needham Initiates BW with Buy, price target: $20)
-RZLV +3.4% (momentum)
-KALU +2.3% (UBS Raised KALU to Buy from Neutral, price target: $184)
-CVX +2.2% (renewed Middle East hostilities)
-EPAM +2.1% (activist hedge fund Engine Capital discloses 1.5% stake in letter pushing for company share buybacks)
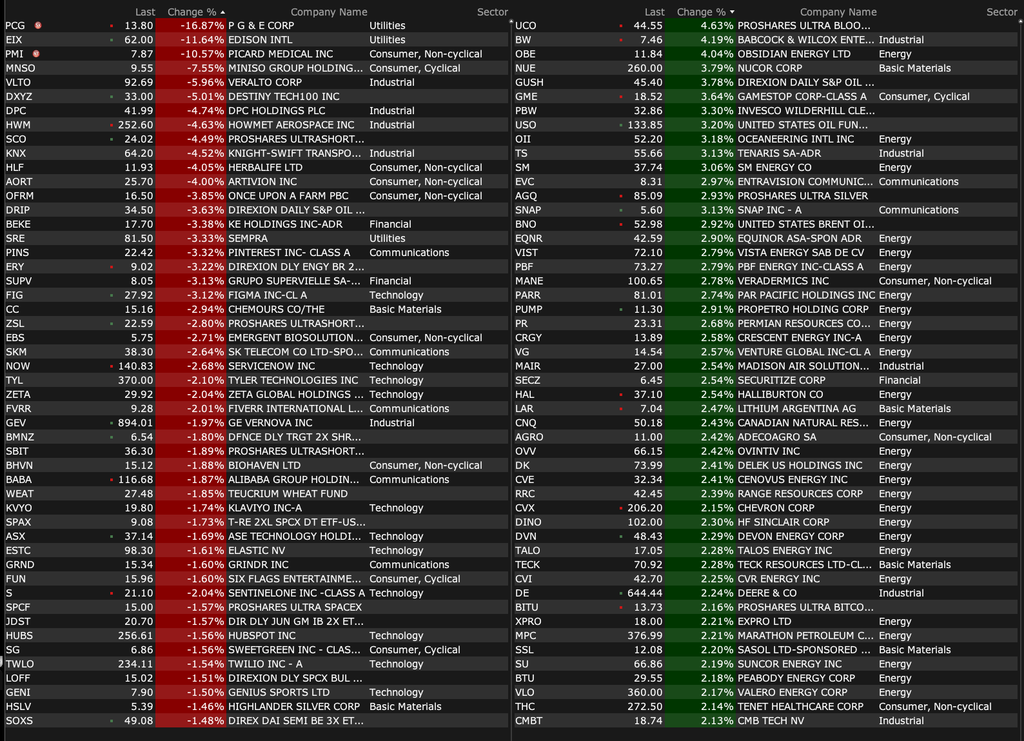
-PCG -16% (State of California legislature amends Senate Bill 492 for wildfire risk reduction, recovery)
-EIX -13% (State of California legislature amends Senate Bill 492 for wildfire risk reduction, recovery)
-MNSO -7.9% (multiple broker downgrades)
-HWM -4.4% (Elon Musk says SPCX could begin making blades, vanes for gas turbine production)
-PINS -3.3% (CFO announces resignation)
BY Doug Kass · Aug 31, 2026, 9:07 AM EDT
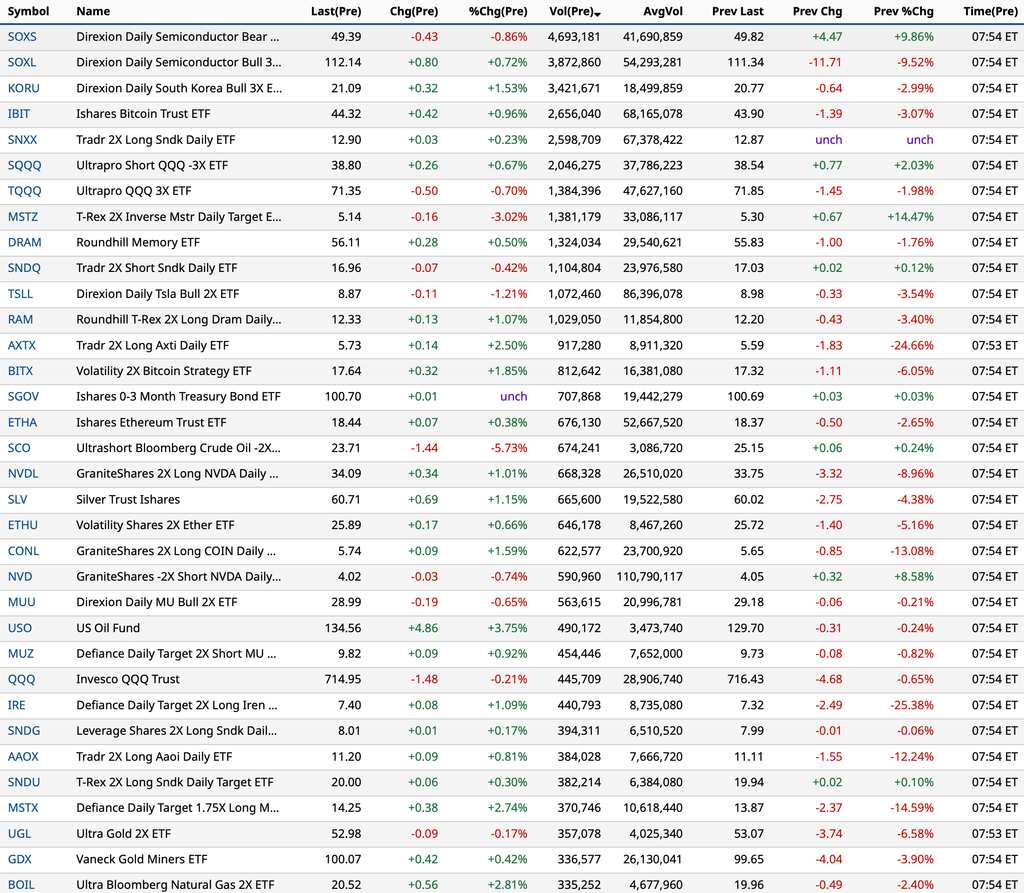
BY Doug Kass · Aug 31, 2026, 8:50 AM EDT
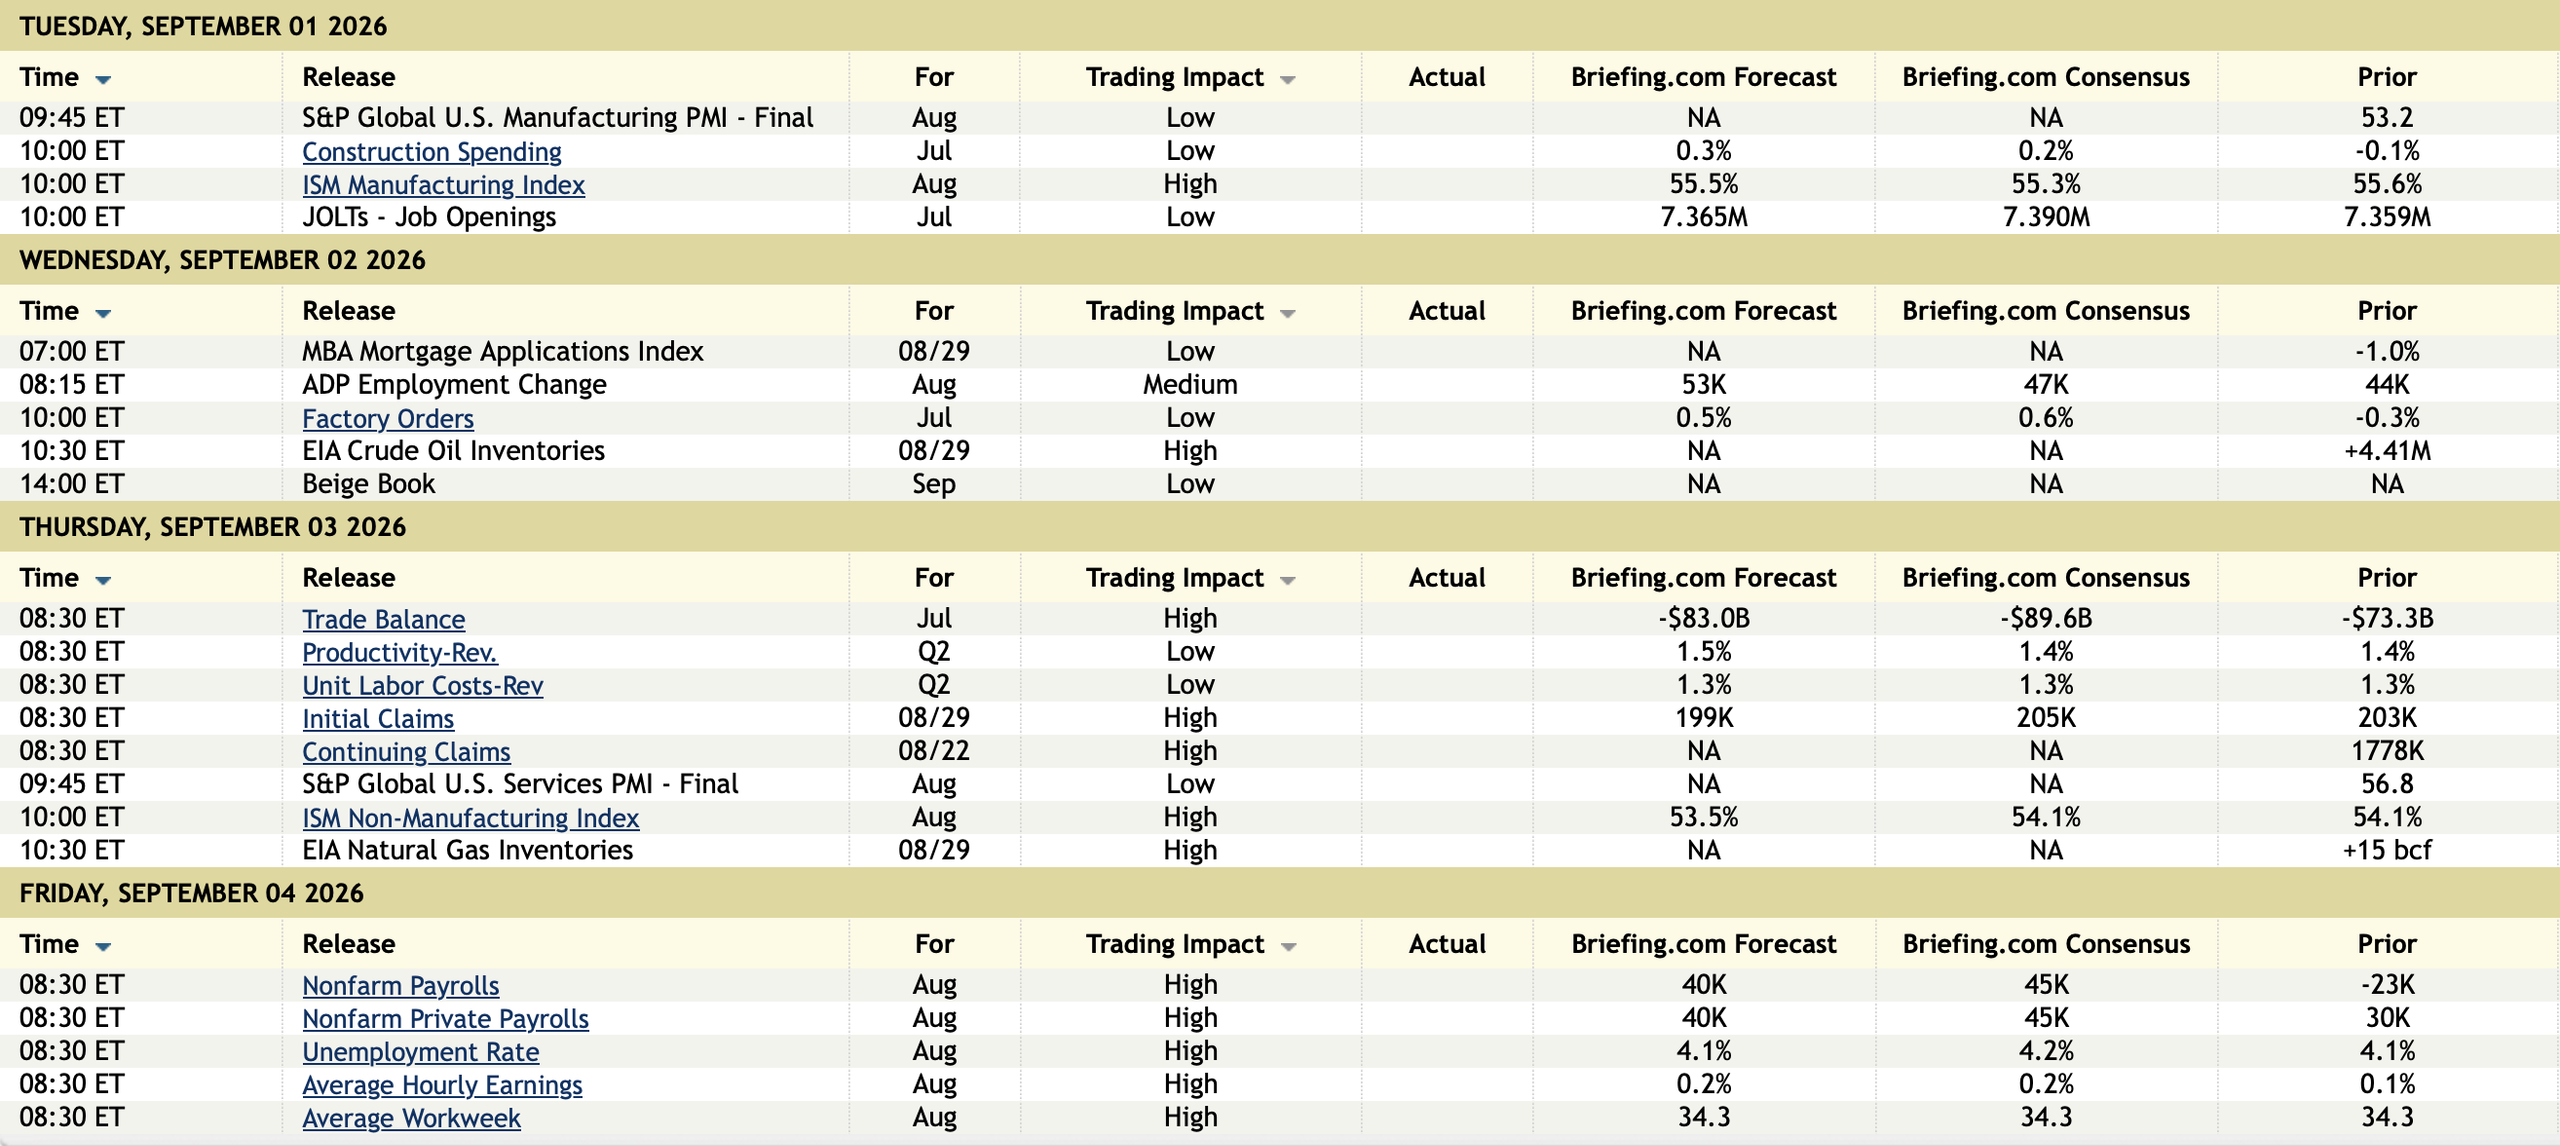
8:00 a.m.: Fed Treasury Repo Reference Rate;
10:30 a.m.: Dallas Fed Manufacturing Activity (August);
3:00 p.m.: Agricultural Prices Paid; Agriculture Prices Received (July)
Positions: None.
BY Doug Kass · Aug 31, 2026, 8:35 AM EDT
BY Doug Kass · Aug 31, 2026, 8:25 AM EDT
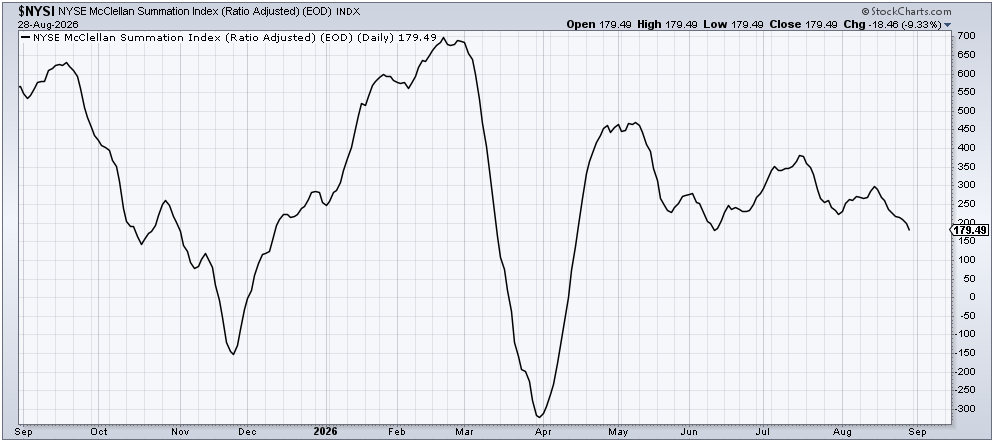
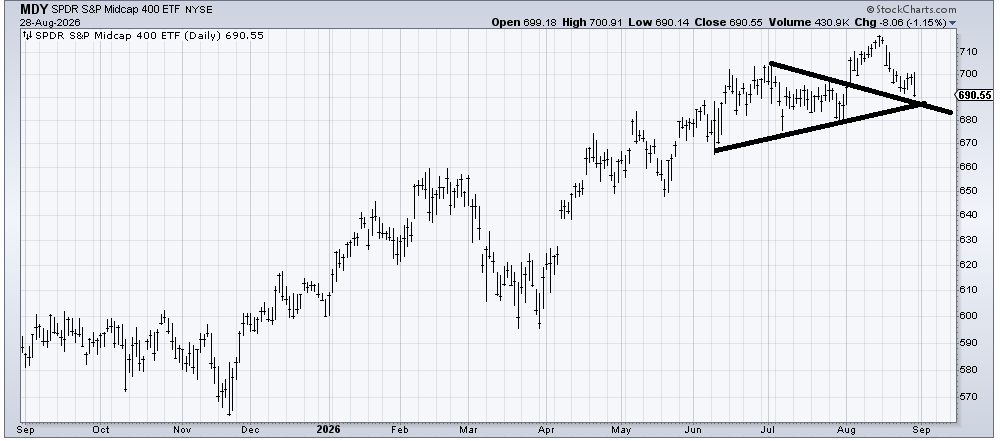
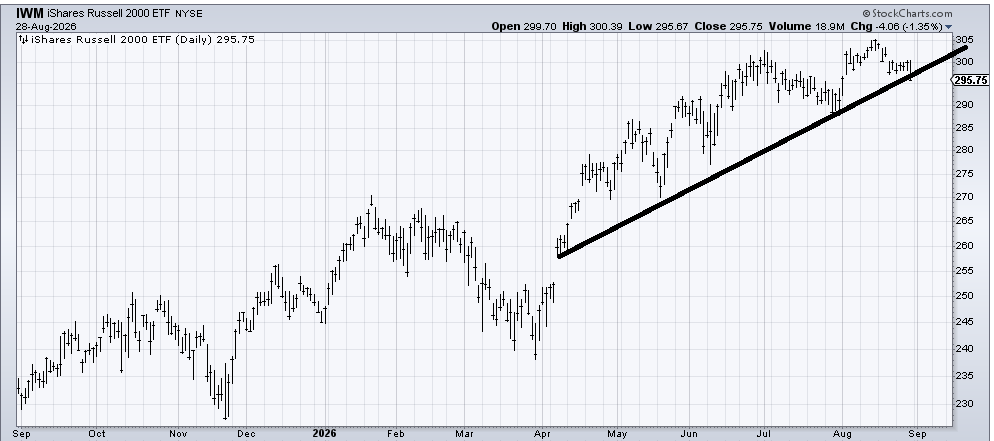
* The McClellan Index (NYSI) is faltering, the Mid Cap Index (MDY) is weakening, the Russell Index (IWM) is not “crowing” nor is the equal weighted S and P Index (RSP) participating in the markets’ recent advance…
Contrary to the near universally bullish narrative of most of the “talking heads” in the business media, the market is not broadening out — at least not as measured by the McClellan Summation Index, the Mid Cap Index, Russell and Equal Weighted S&P Indices.
Let’s look at the facts and charts, delivered by The Divine Ms M (Helene Meisler) on TheStreetPro this morning:
When we look back at the month of August, you might recall I had been of the mind that the ‘others’ would have a difficult month. It did not pan out as I envisioned. However, indicator-wise, you can see perhaps it has. Look at the McClellan Summation Index, which I think shows us what the majority of stocks are doing. It has been trending down for more than two weeks already, and if you squint hard enough, you can see it has made a lower low than late July and is closing in on the early June low.
If we look at the chart of the Mid Caps, we can see they are pretty much down on the month. The chart shows that rise early in the month that has been leaking without much fanfare for the last two weeks. It is coming into some decent support in the 685 area.
The IWM hasn’t escaped the same type of leakage. It too is back where it was in early August, having given up the gains that got folks so excited early in the month. It is also back where it was in June.
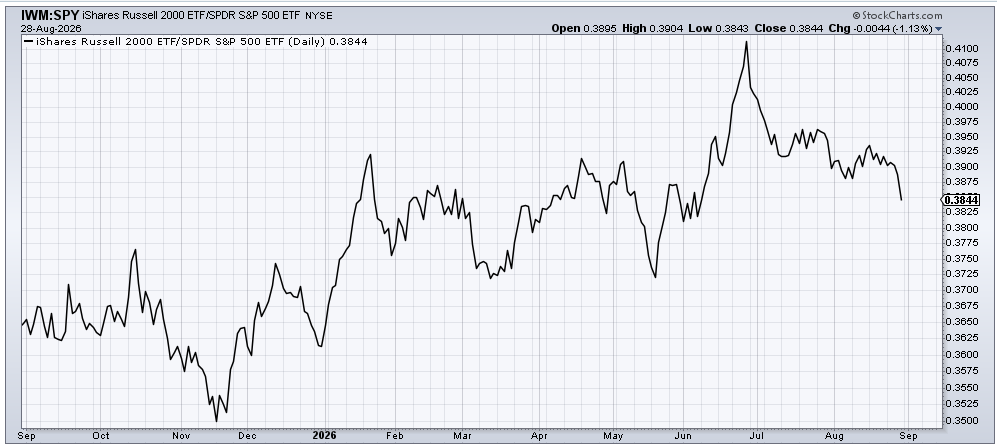
For all the hootin and hollerin about how great small caps were (are?) relative to large caps, the ratio of IWM to SPY says that narrative is wrong. That ratio peaked two months ago and just made a minor lower low. You can see it accelerated in the last week.
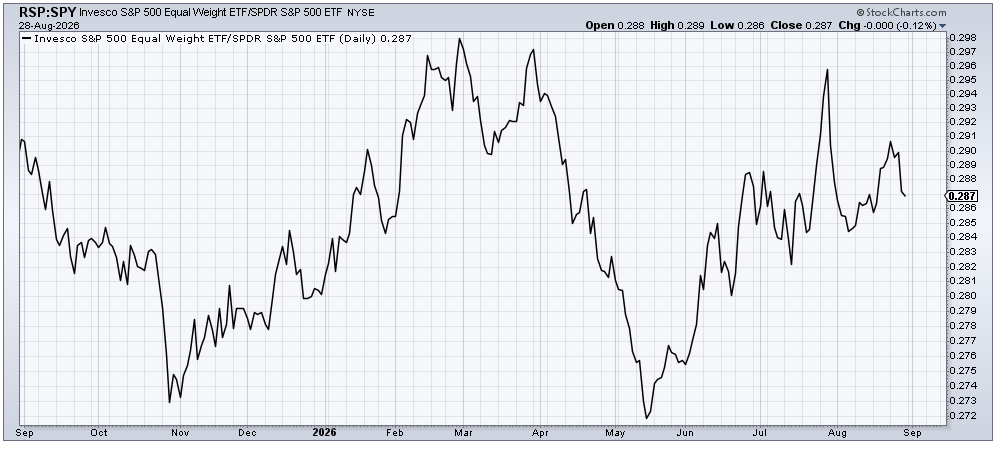
And what of everyone’s new favorite ETF, the RSP (equal-weight S&P)? Aside from the fact that the ratio peaked back in late February, notice all that supposed broadening out peaked in late July—exactly when the SOX/tech stocks made their lows. This ratio turned south last week as well.
When you see these charts, you can understand why in the very short term, the market seems oversold. But you can also see that the Either/Or Market remains intact.
Position: None
BY Doug Kass · Aug 31, 2026, 7:30 AM EDT
Position: None
BY Doug Kass · Aug 31, 2026, 6:31 AM EDT
Position: None
BY Doug Kass · Aug 31, 2026, 6:15 AM EDT
Position: None
BY Doug Kass · Aug 31, 2026, 6:05 AM EDT
Position: None
BY Doug Kass · Aug 31, 2026, 5:55 AM EDT
The S&P Short Range Oscillator is slightly oversold at -1.13% vs. -0.82%
Position: None
BY Doug Kass · Aug 31, 2026, 5:45 AM EDT
🇺🇸 S&P 500 The S&P 500 has run well ahead of its long‑term median over the past years, but that kind of strength will be tough to repeat from today's valuation levels 👉 isabelnet.com/?s=S%26P+500 @GoldmanSachs $spx #spx #sp500 #stocks #equity

🇺🇸 S&P 500 History paints September as the worst month for US stocks, with the weakest average return since 1950. But this year, August, typically sluggish in midterm years, is already up 3%. Do the odds look different this time? 👉 isabelnet.com/?s=S%26P+500 h/t @RyanDetrick $spx

Happy 96th birthday to Warren Buffett. When you invited me to be the "credentialed bear" and to ask tough questions to you and Charlie (on the dais) at the 2015 Berkshire Hathaway Annual Meeting - you provided me with one of the thrills of my lifetime. Doug Kass at BERKSHIRE Show more
⚠️Volatility is EXPLODING beneath the surface of the US market: While broad stock-market volatility remains relatively subdued, single-stock and cross-sector volatility have surged to their highest levels since the 2020 CRASH. Single-stock volatility measures how muchShow more


