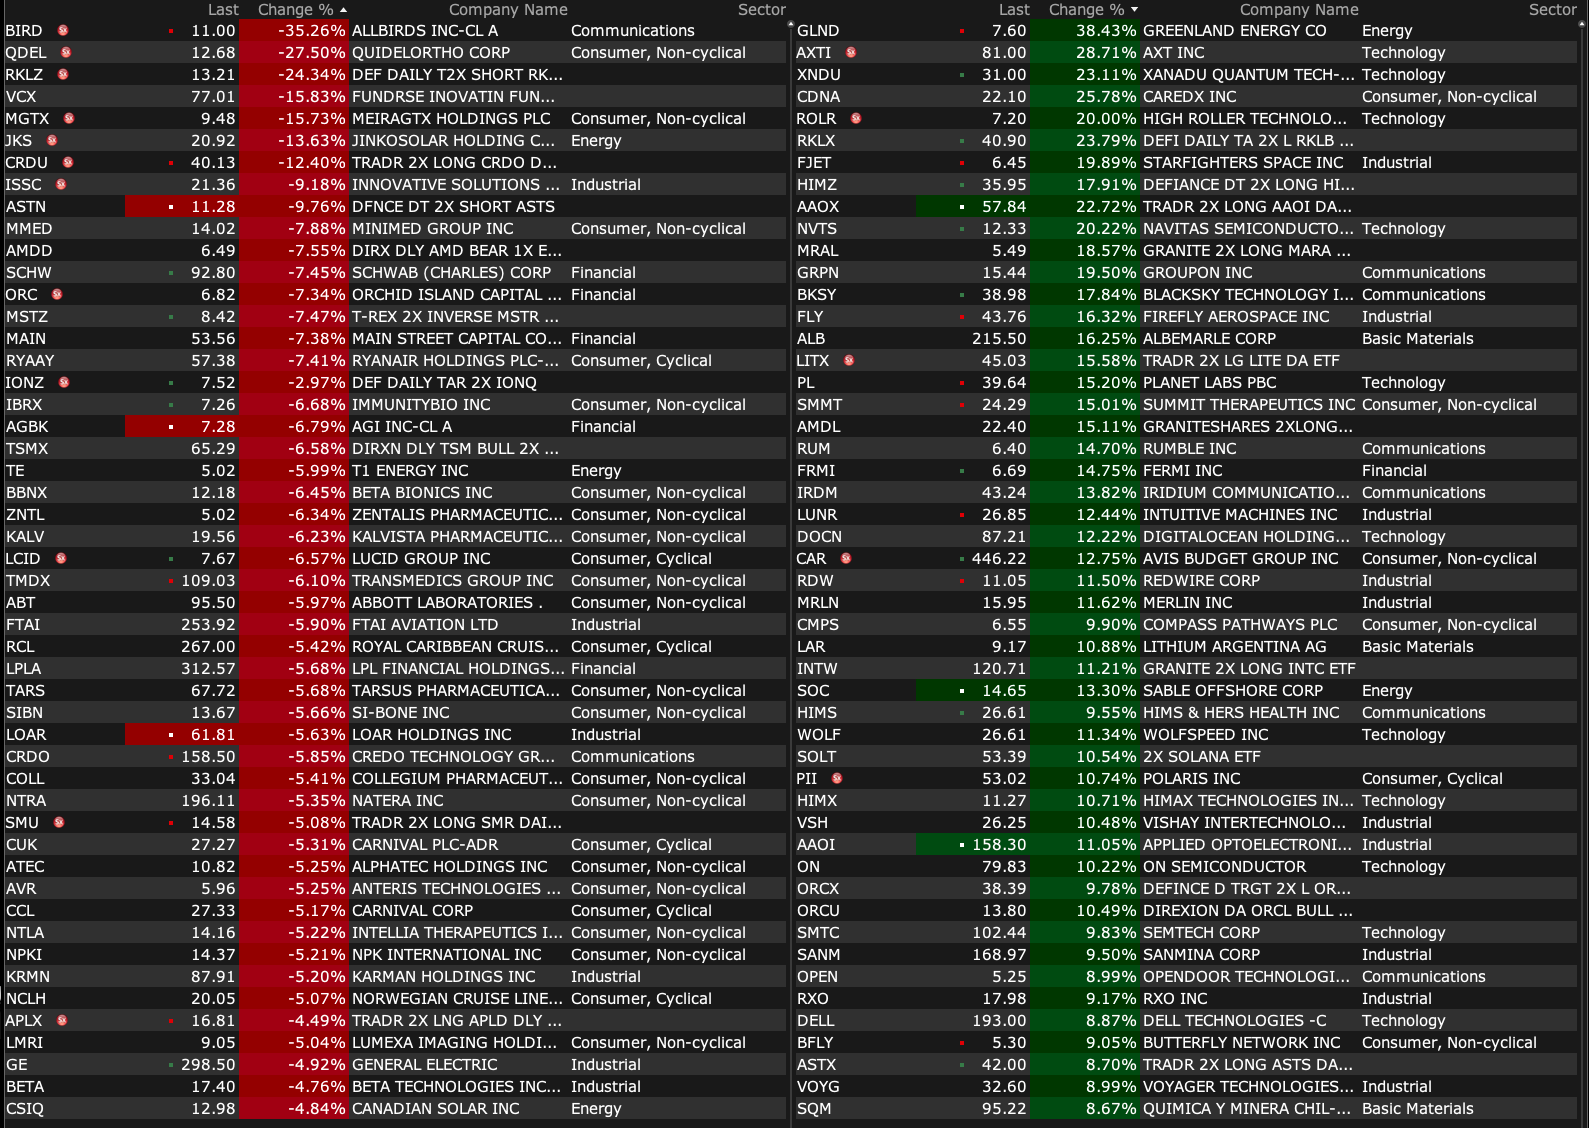
Thursday's After-Hours Advancers and Decliners
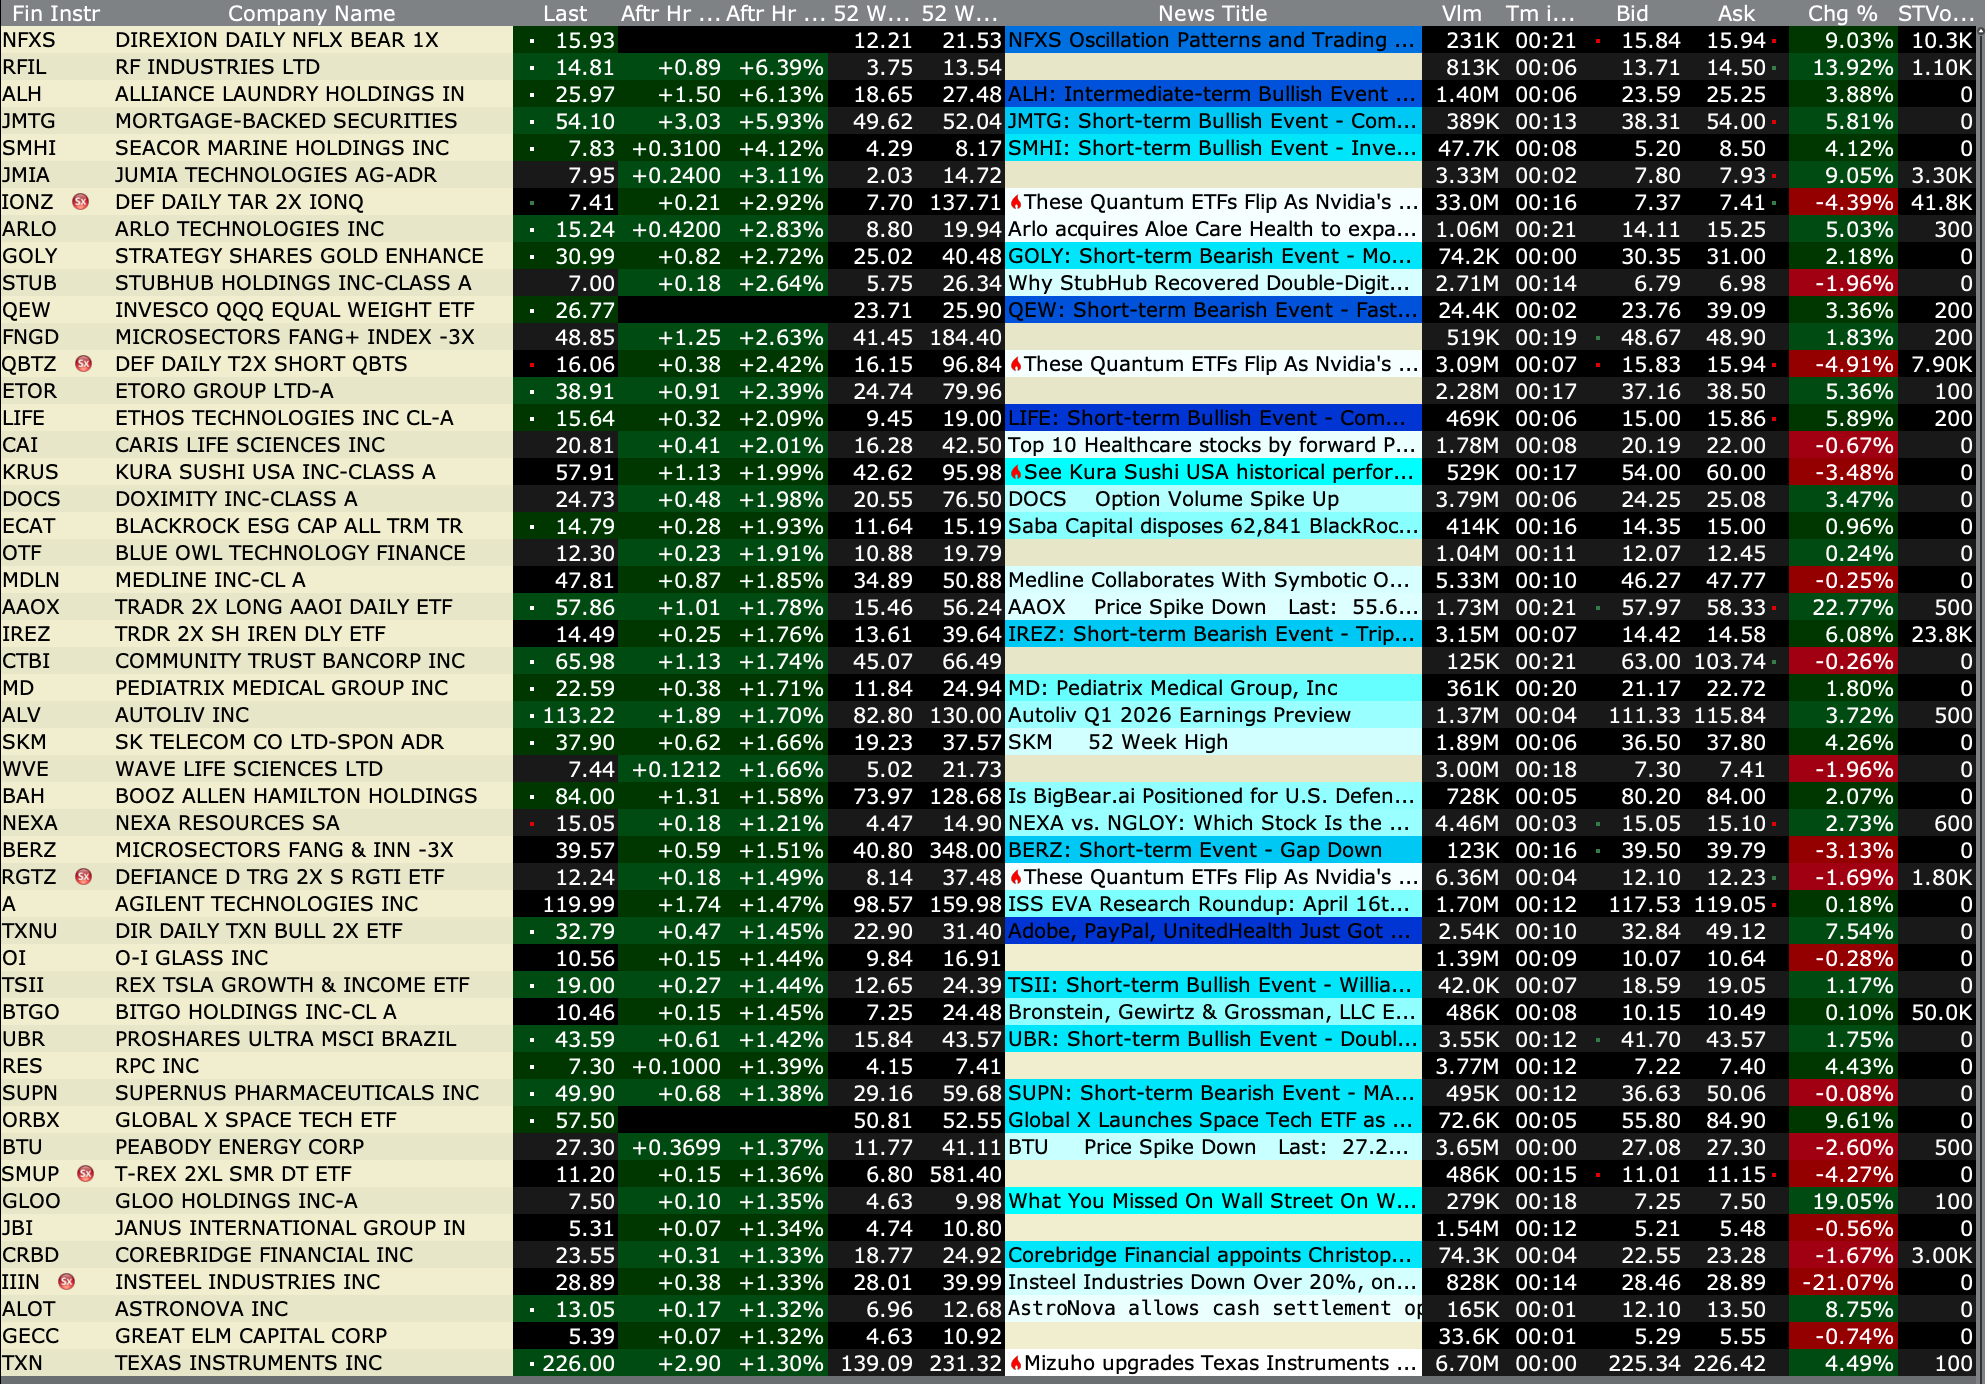
After-Hours % Advancers
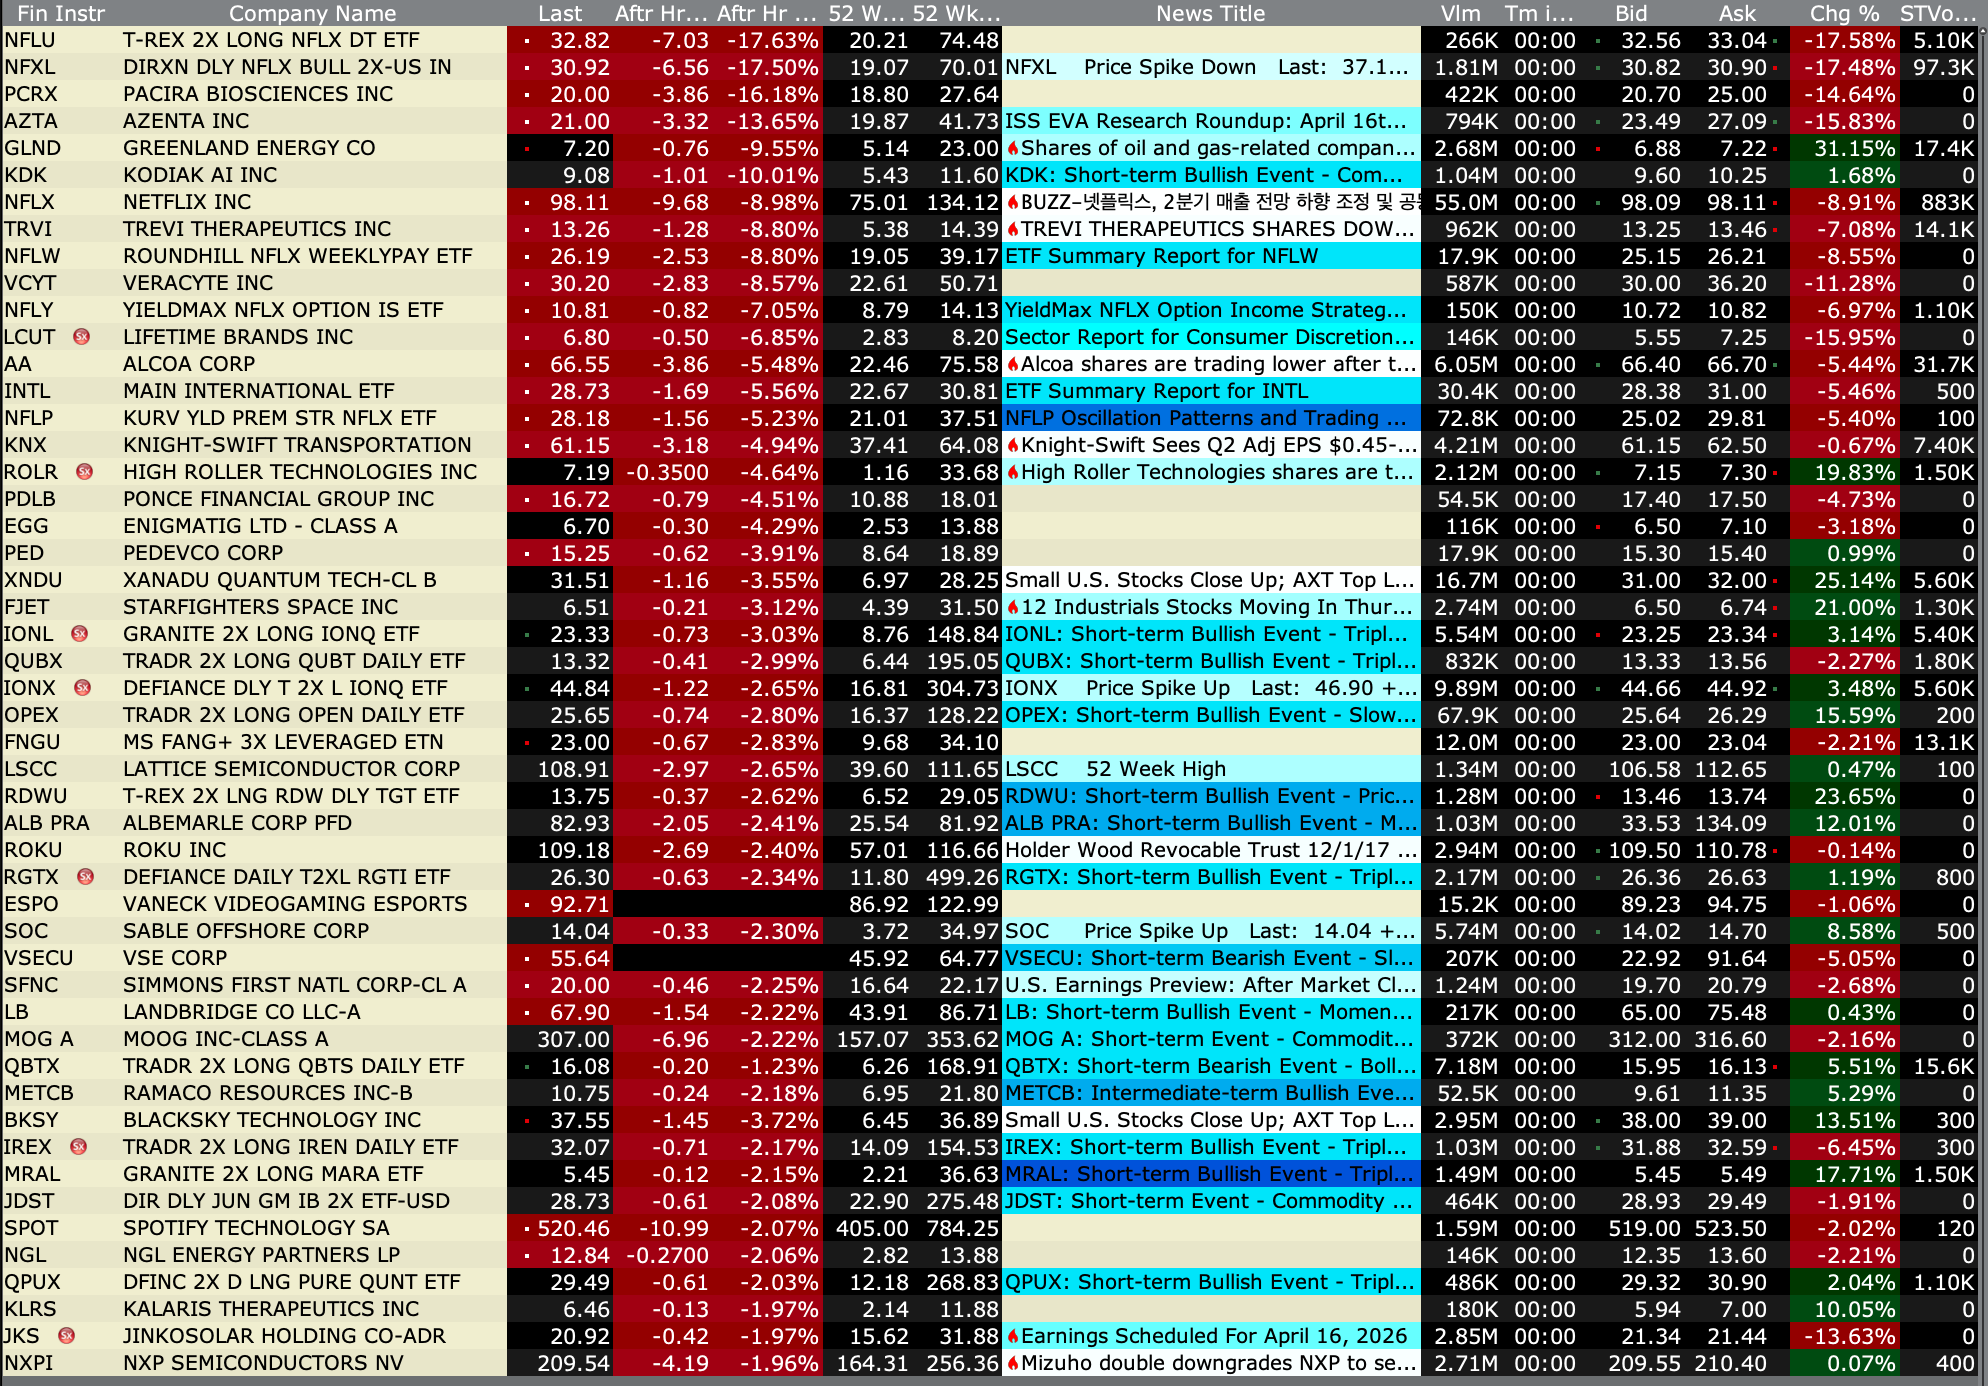
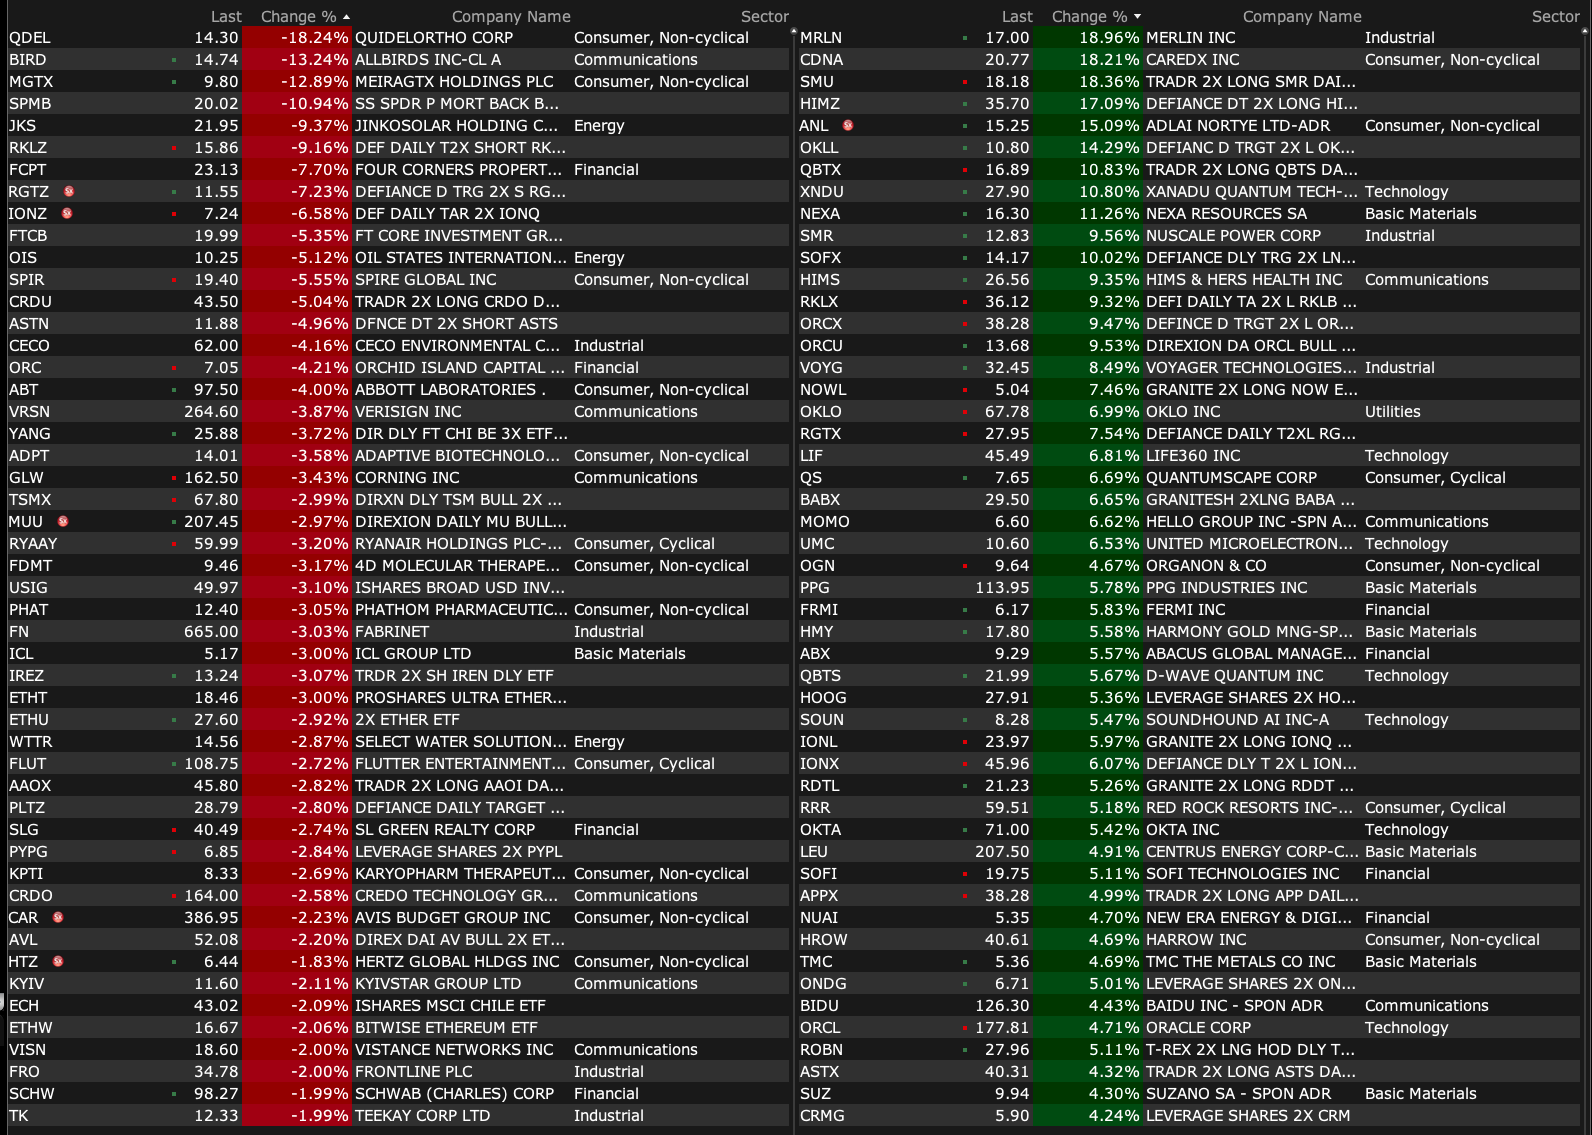
After-Hours % Decliners
BY Doug Kass · Apr 16, 2026, 4:35 PM EDT
After-Hours % Advancers
After-Hours % Decliners
BY Doug Kass · Apr 16, 2026, 4:35 PM EDT
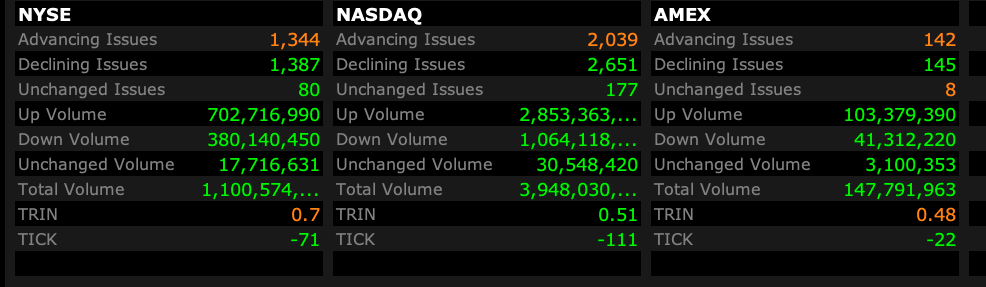
Closing Volume
- NYSE volume 9% below its one-month average
- NASDAQ volume 15% above its one-month average
- VIX index: down 1.38% to 17.92
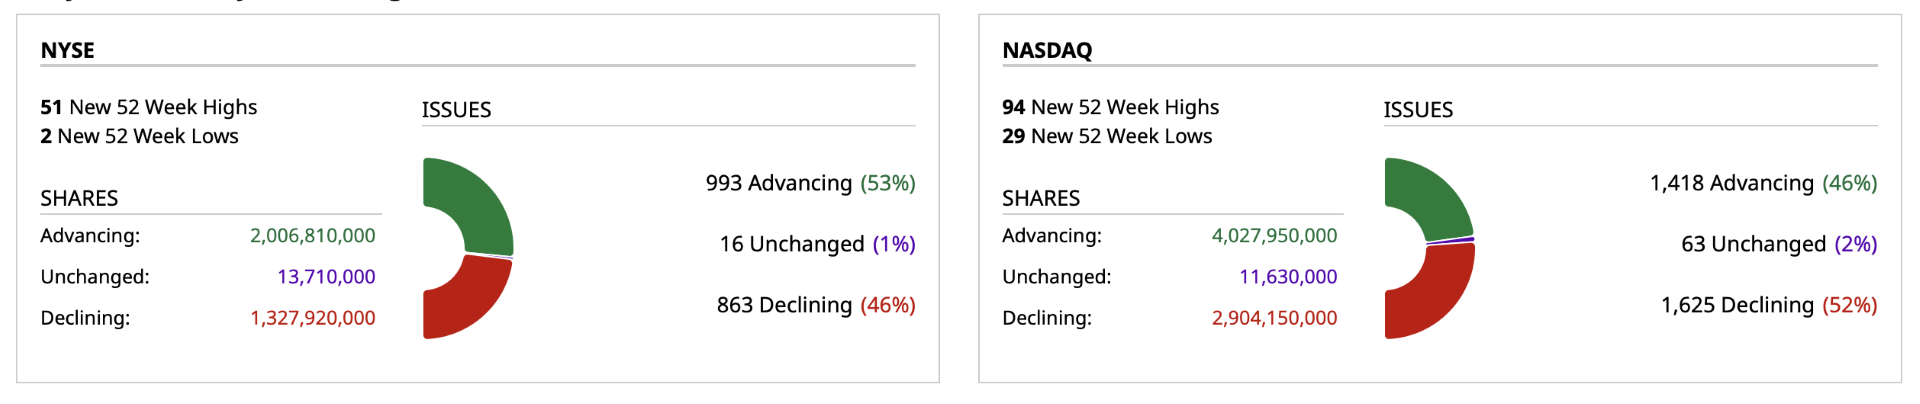
Breadth
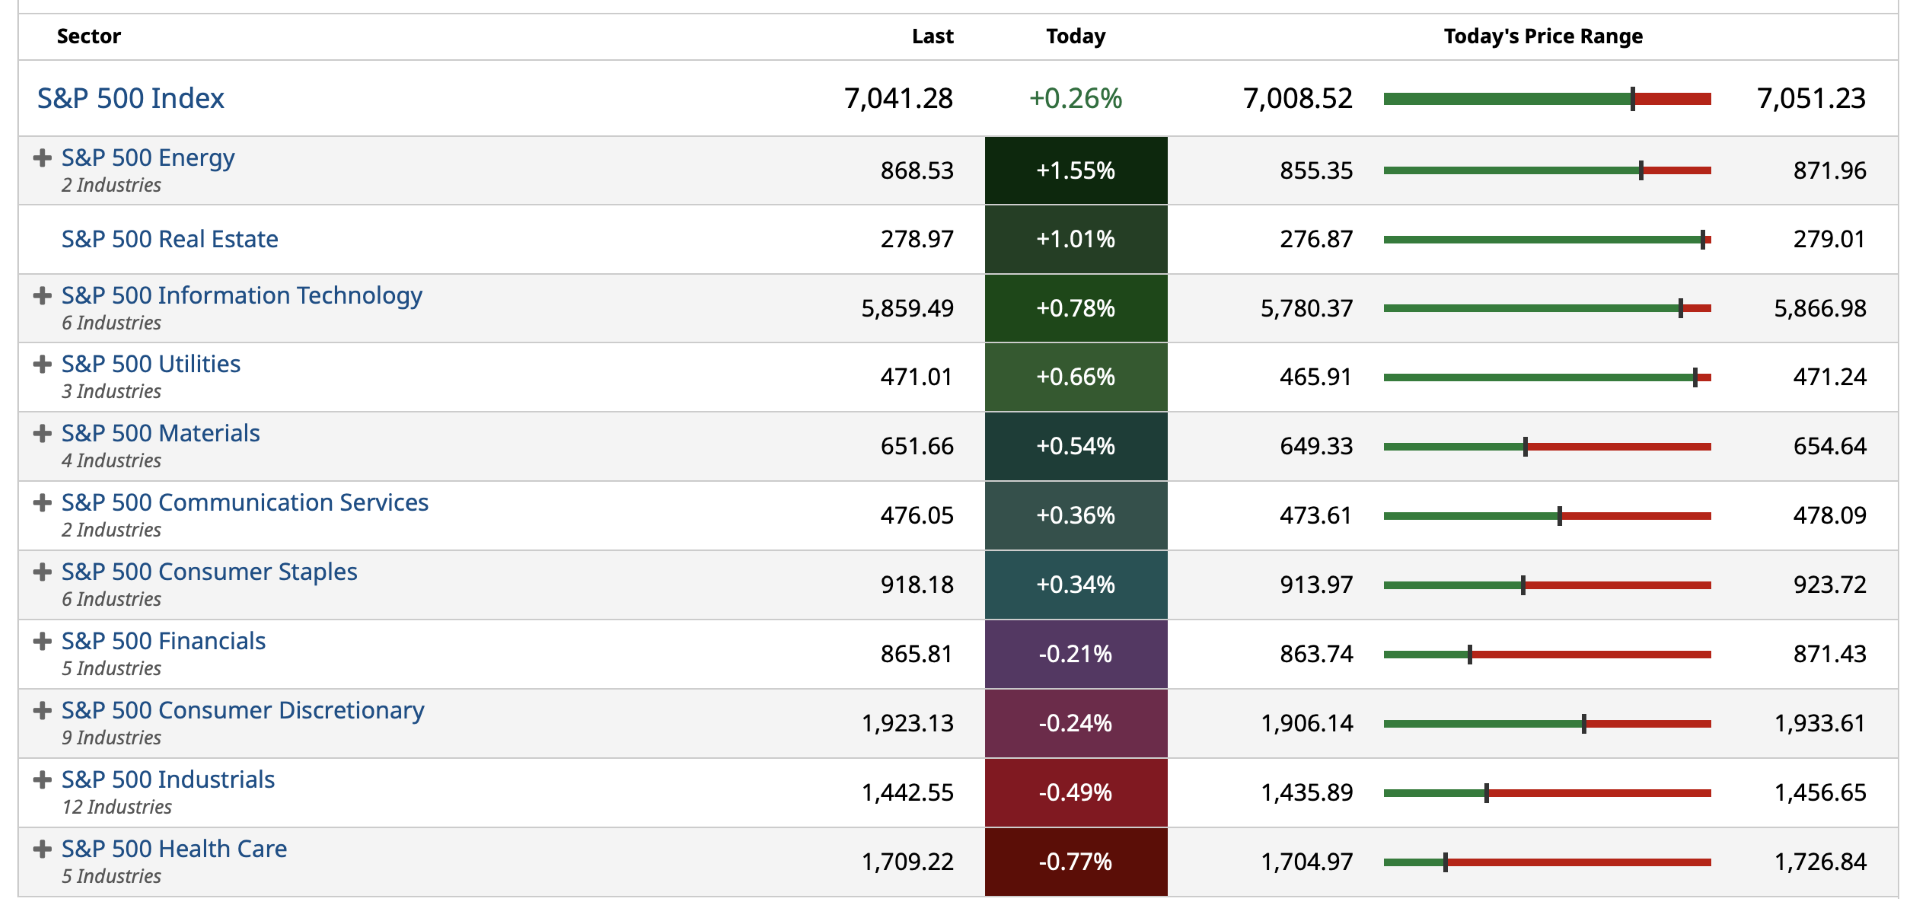
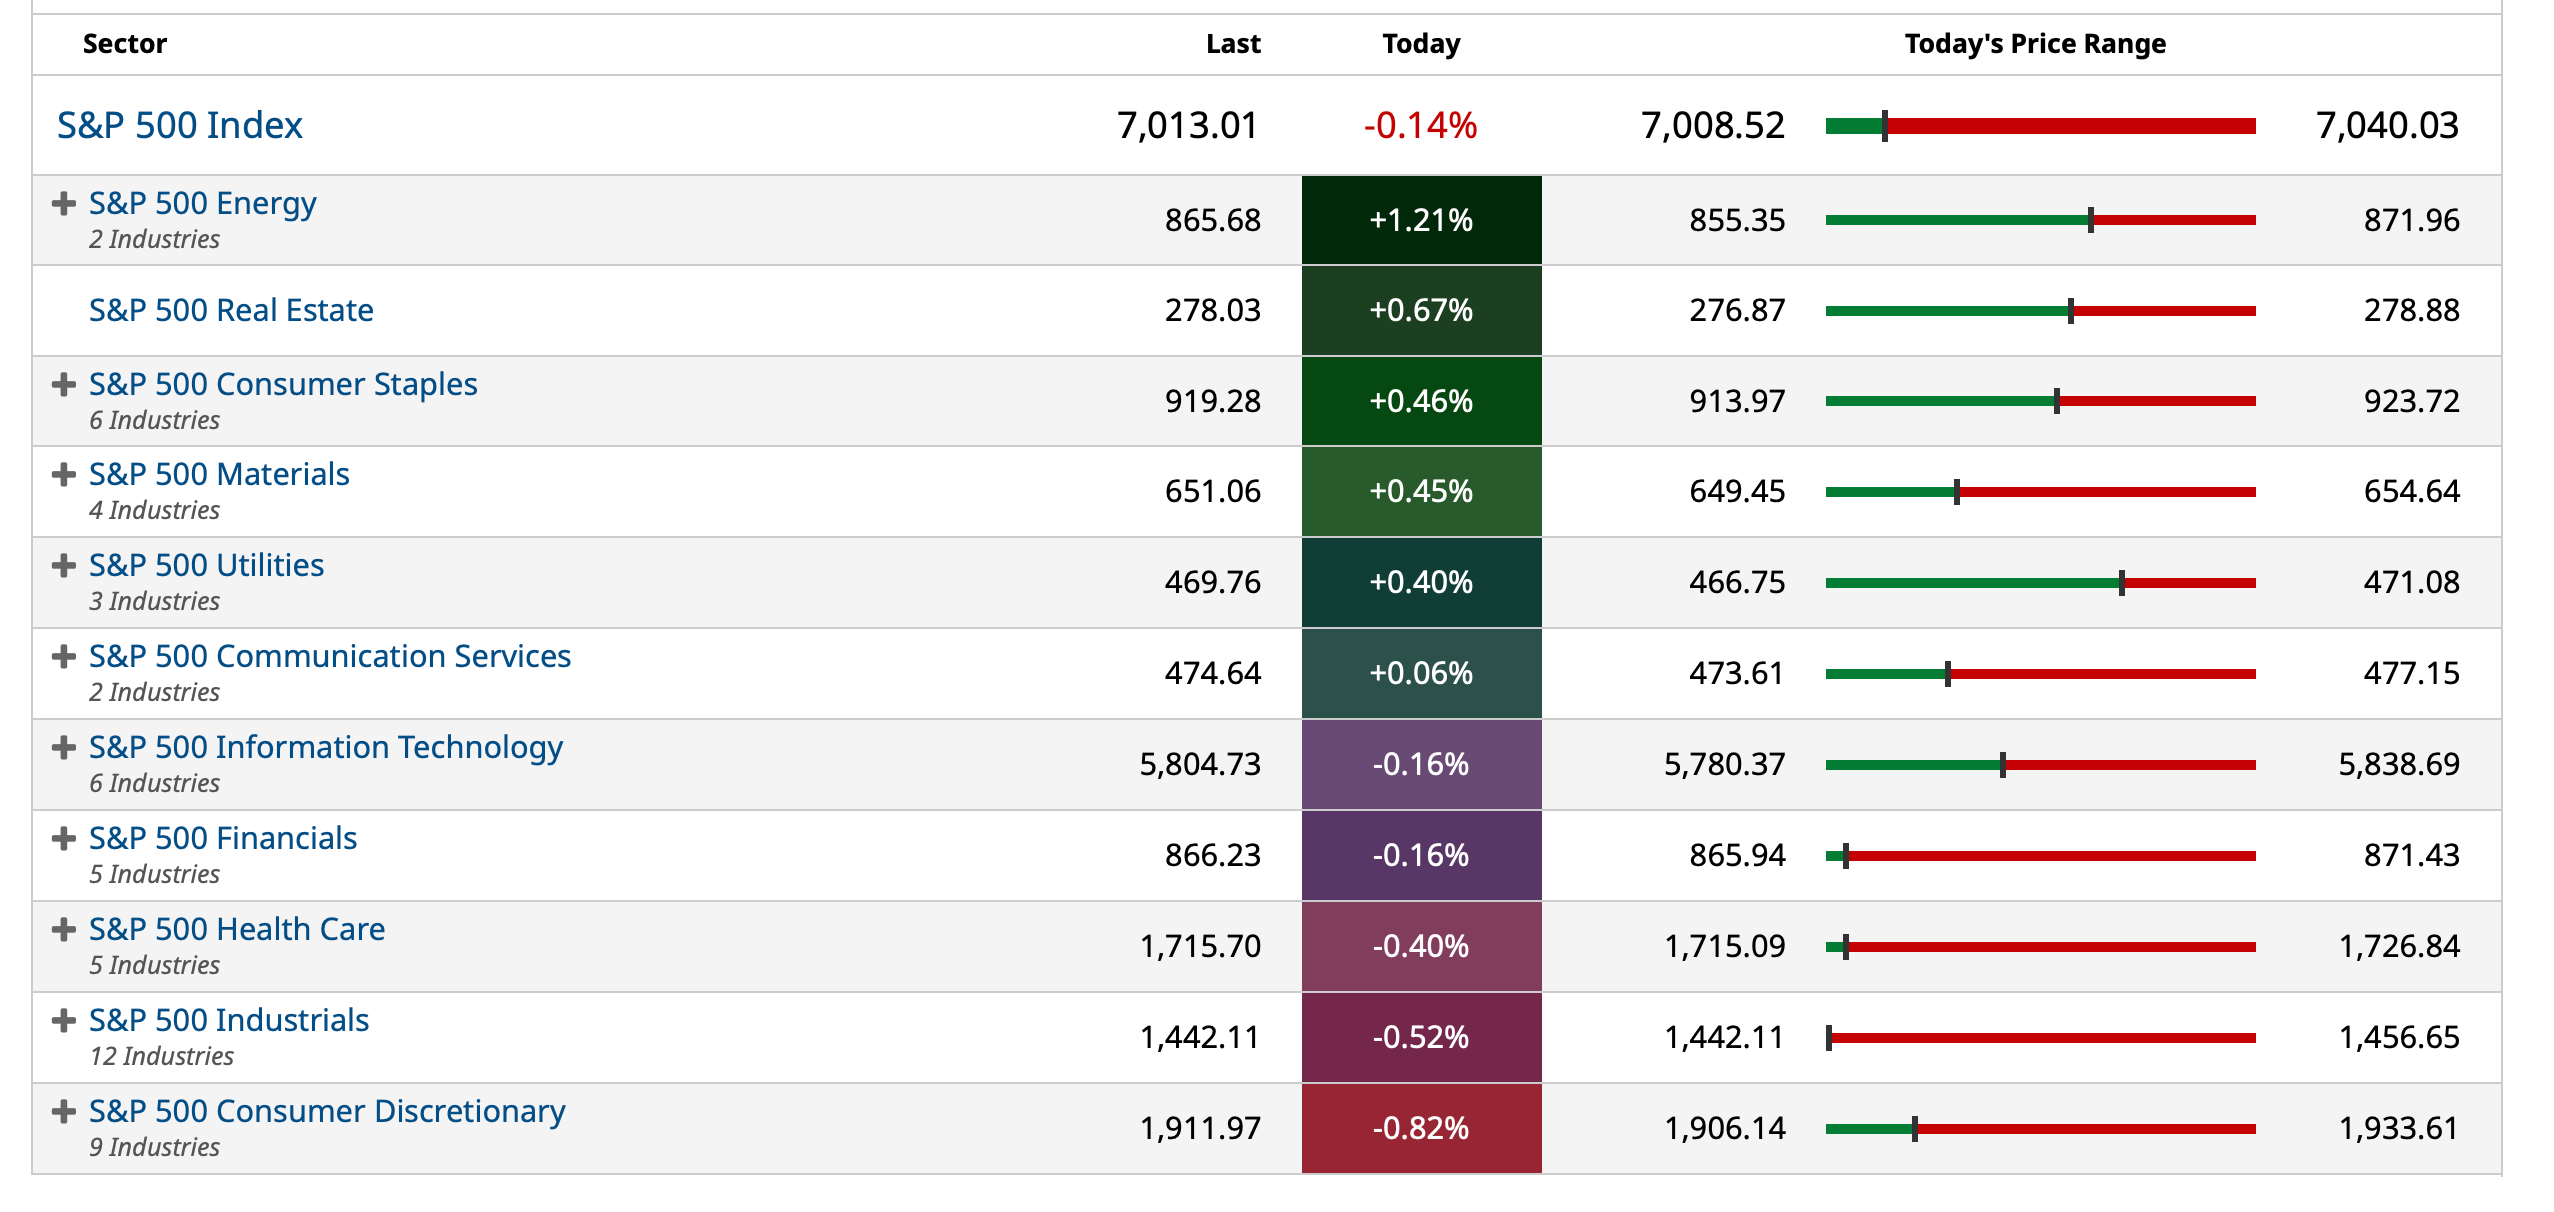
S&P 500 Sectors
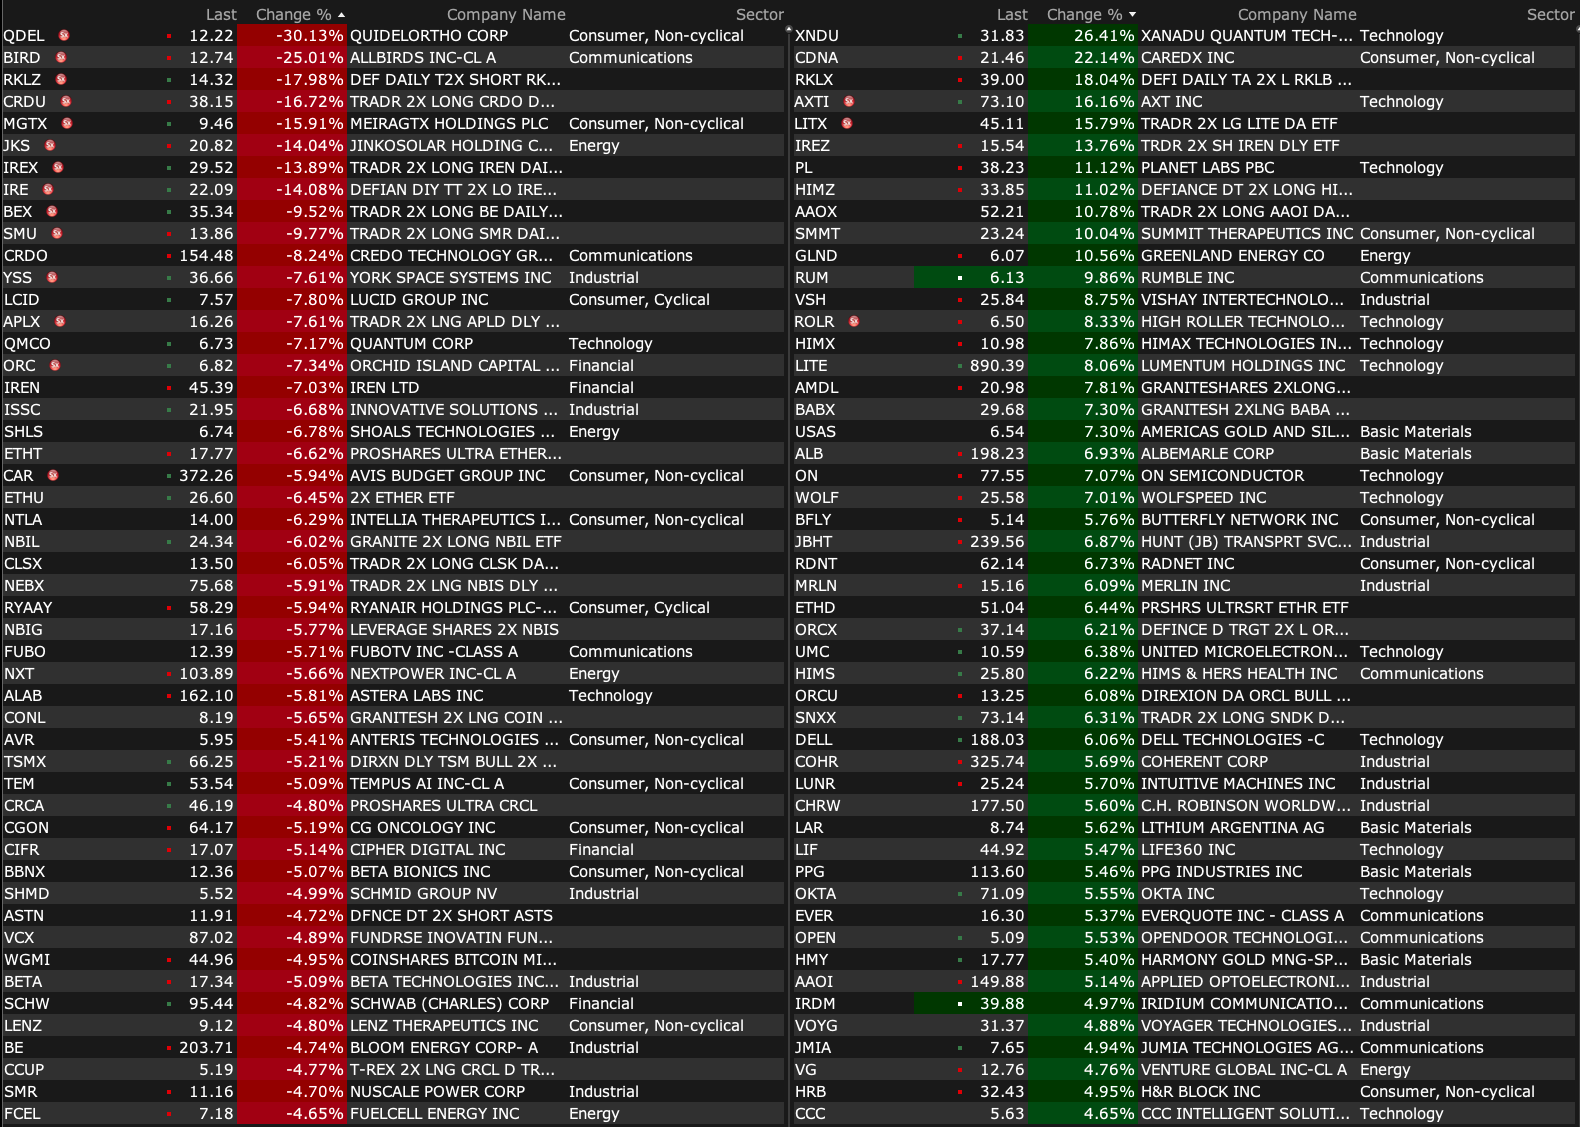
% Movers
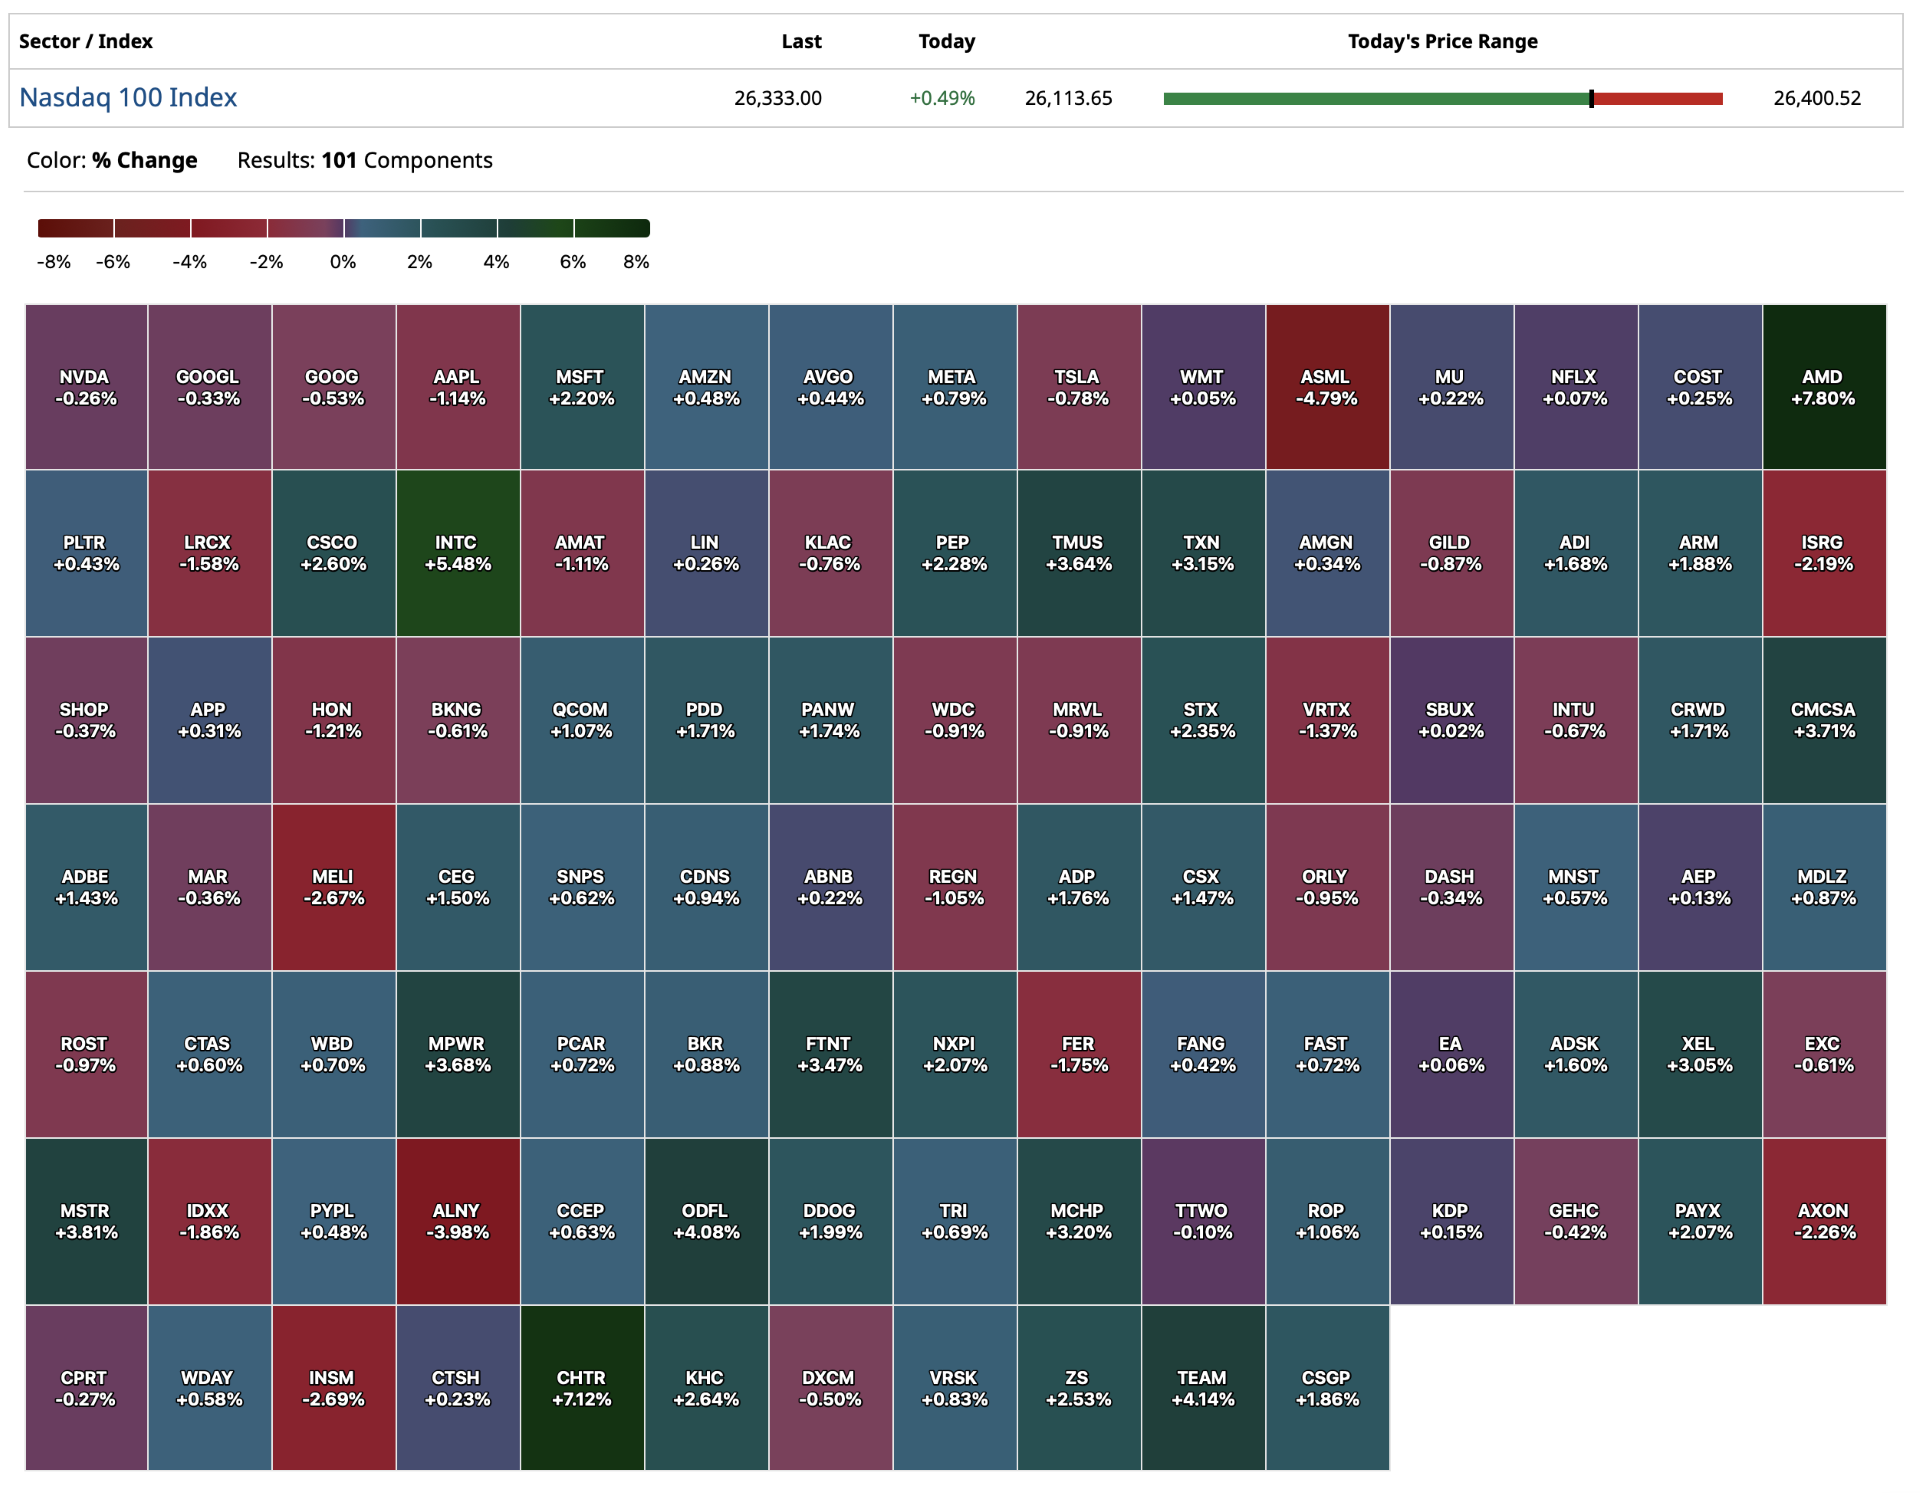
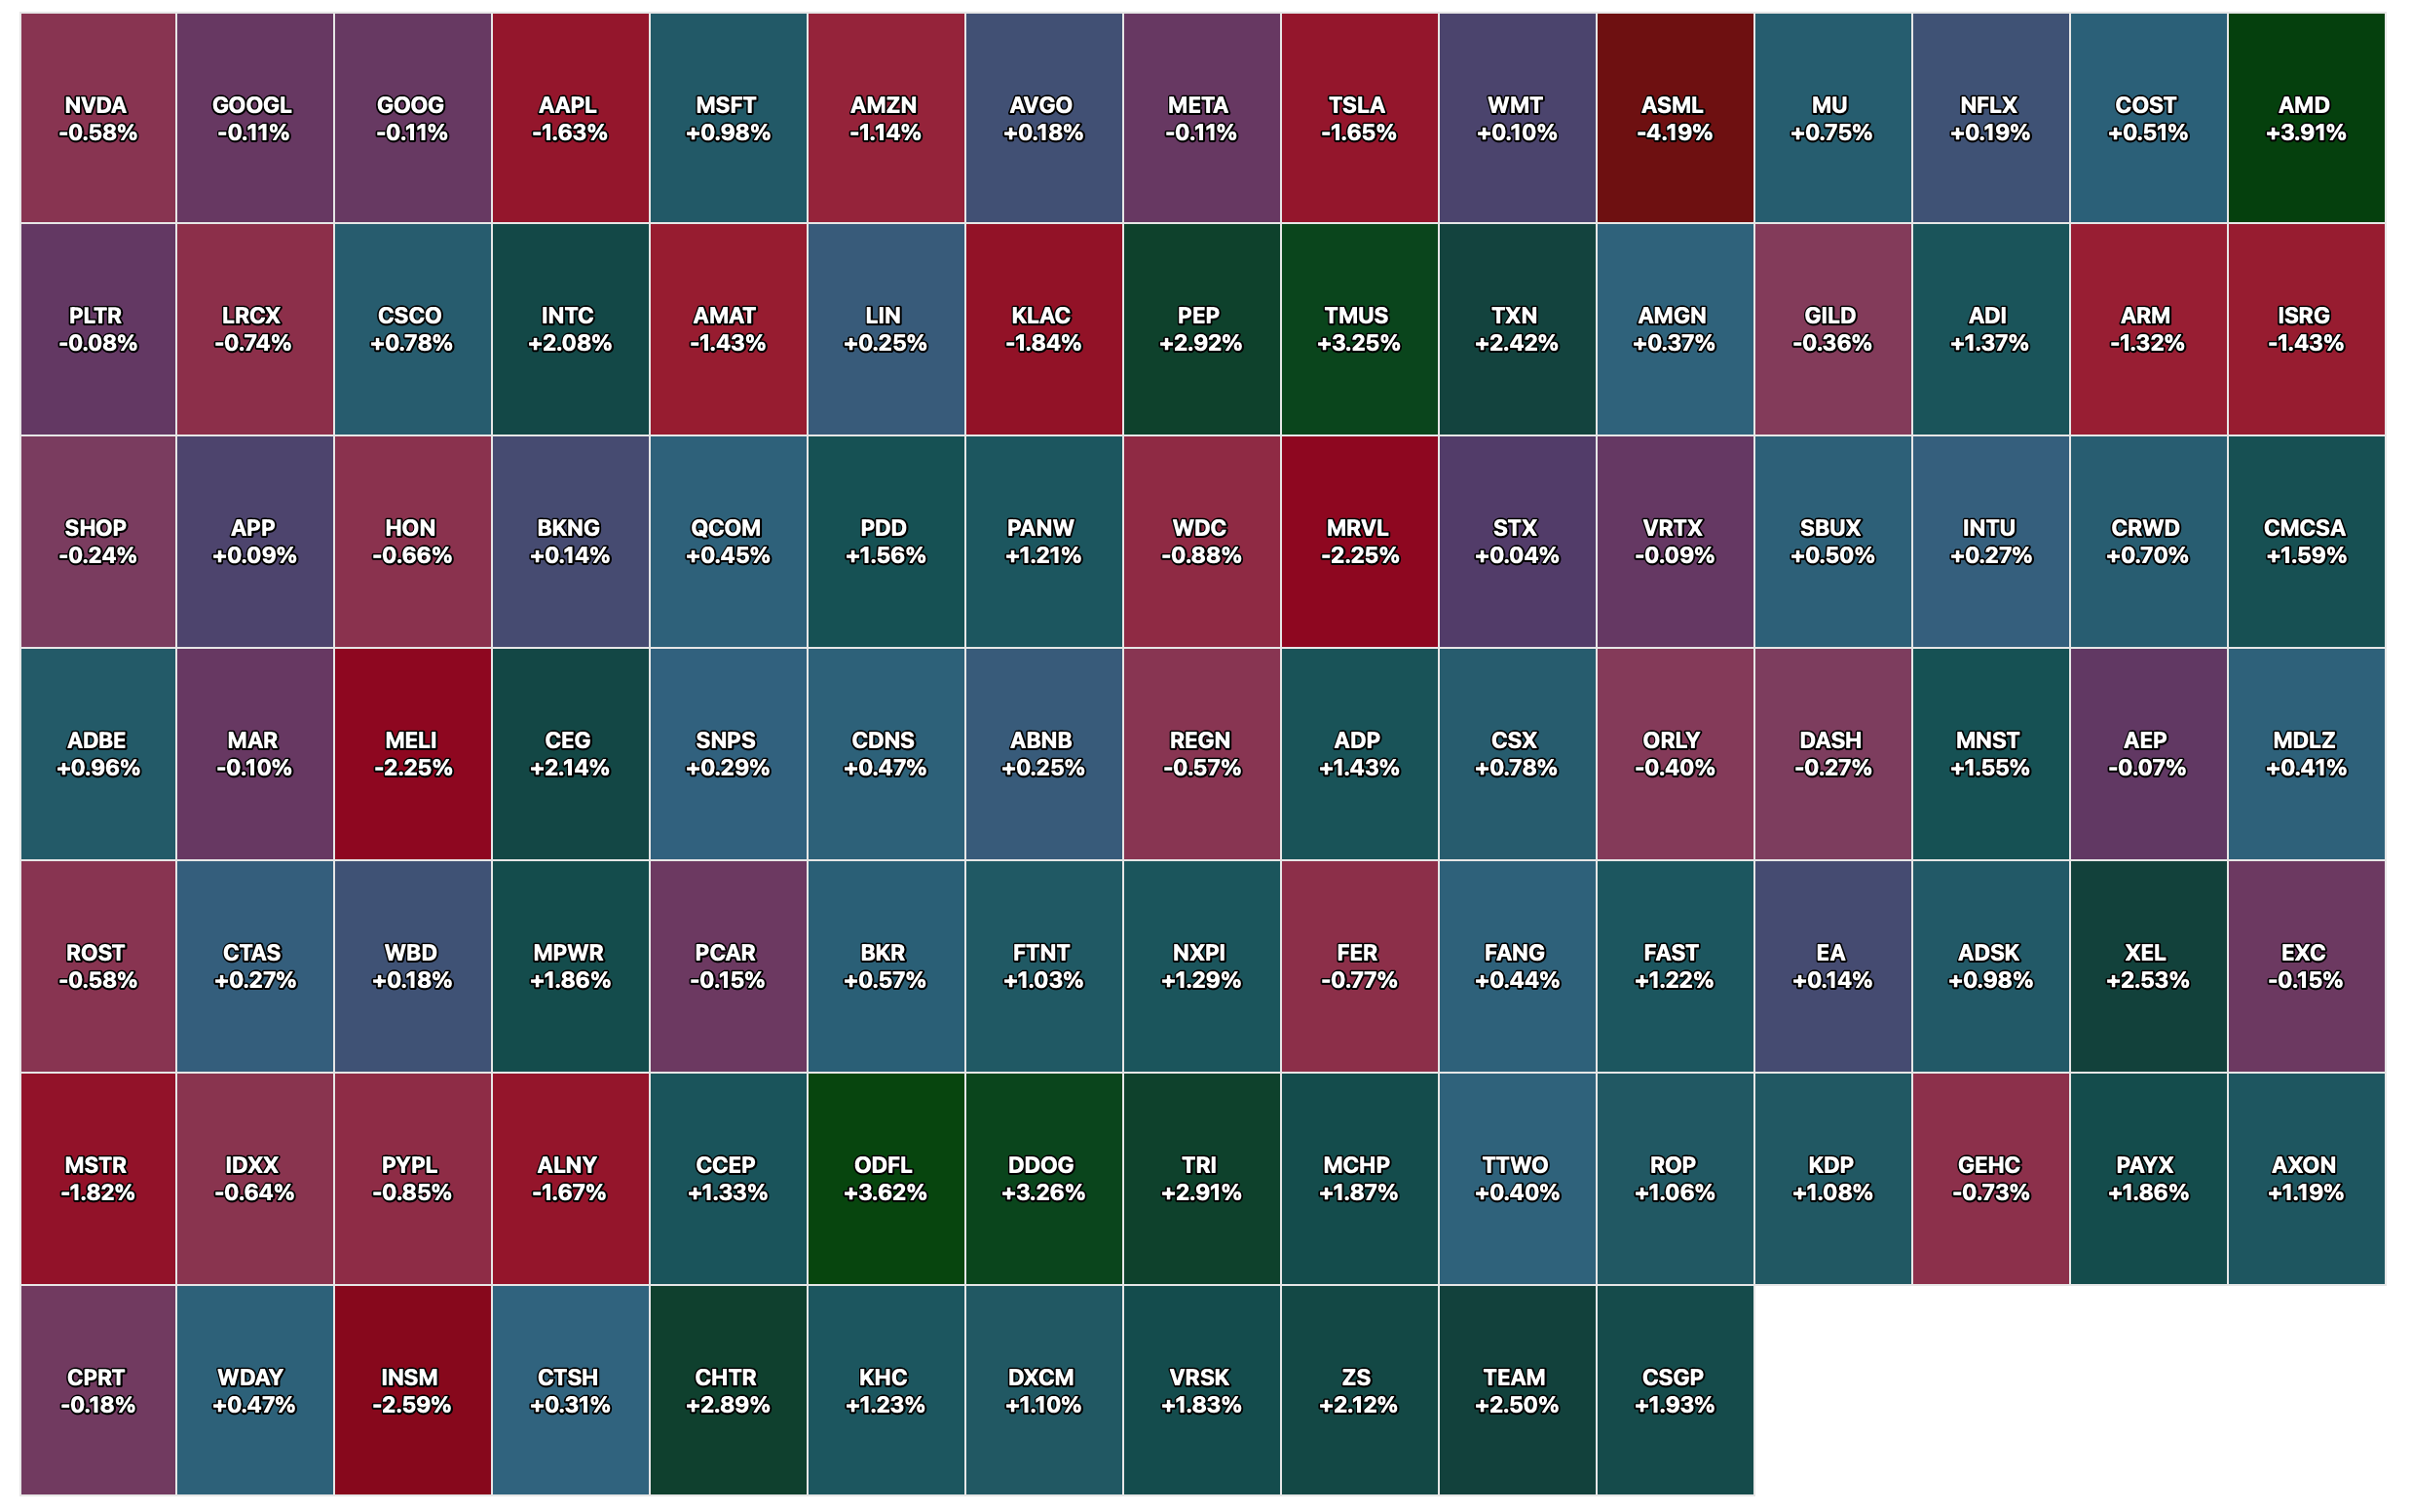
Nasdaq 100 Heat Map
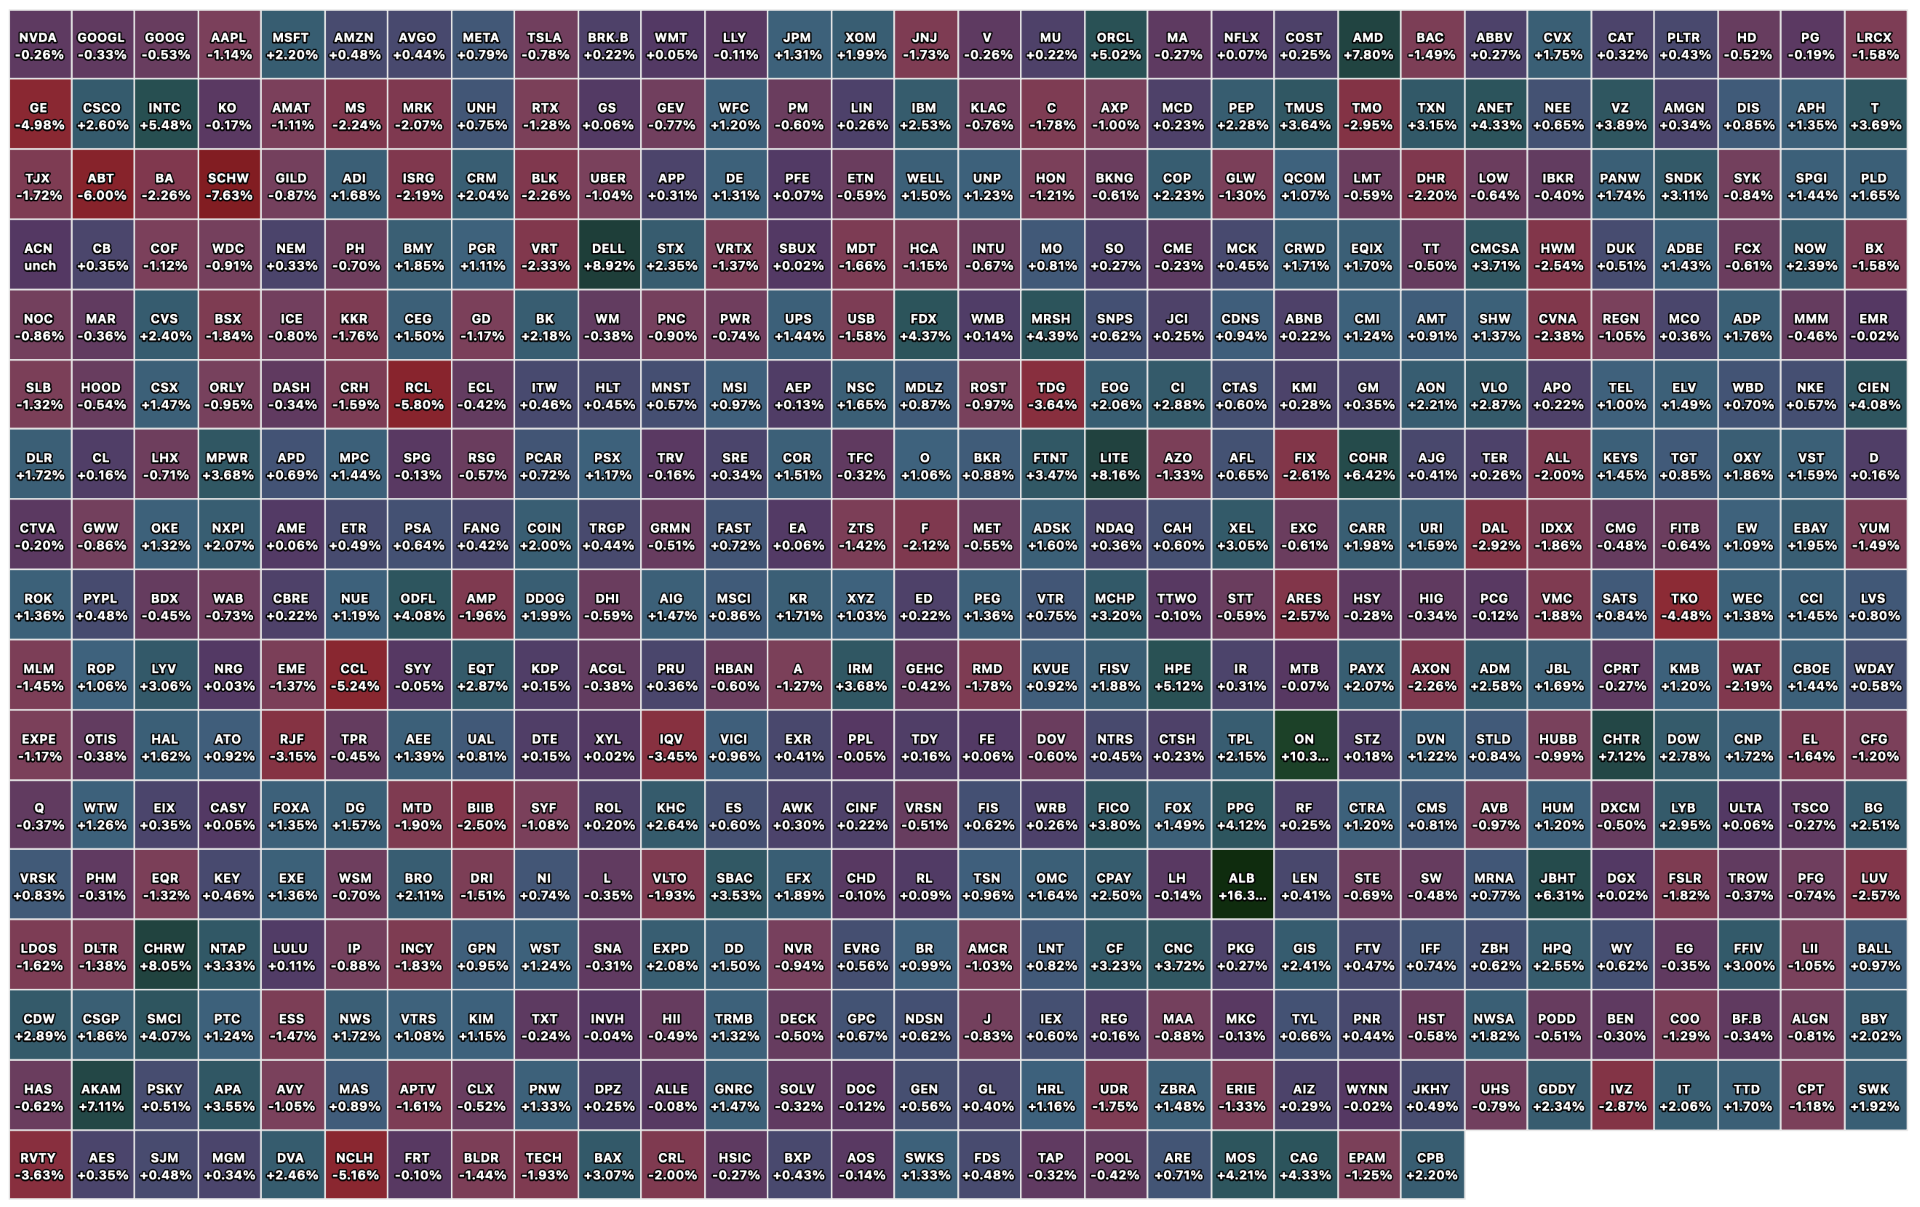
Closing S&P 500 Heat Map
BY Doug Kass · Apr 16, 2026, 4:24 PM EDT
BY Doug Kass · Apr 16, 2026, 3:58 PM EDT
I am slipping out early as I have a dental consultation in preparation for some surgery next week.
Thanks for reading my Diary.
Enjoy your evening.
BY Doug Kass · Apr 16, 2026, 3:30 PM EDT
Expectations were low going into PepsiCo's (PEP) quarter.
The company exhibited better top-line, bottom-line (+9%, a five-cent beat) and, importantly, sequential organic sales growth (+2.6% vs. 2.0% E) in Q1 2026.
The shares are +$3.30 today.
The beverage company's product pipeline is strong (several new protein beverages) as PEP tries to accelerate its product transformation.
More early next week...
PEP remains my "Stock of the Year."
Here is the EPS release. Q1 2026 8-K - Exhibit 99.1
Position: Long PEP (S)
BY Doug Kass · Apr 16, 2026, 2:30 PM EDT
* Fear and doubt has left the building...
Blinded by and comforted by the security of higher stock prices, the parade of guests on Fin TV have become the "see no evil, hear no evil" crowd in The Bull Market of Complacency.
— Dougie Kass (@DougKass)
One month ago and ten percent lower most hated the stock market.
The herd knows everything about…
BY Doug Kass · Apr 16, 2026, 2:17 PM EDT
Crude at the high of the day (+$3.20).
BY Doug Kass · Apr 16, 2026, 1:23 PM EDT
* It's not specifically too good
* But it's your own trip!
- Chip Monk WOODSTOCK brown acid announcement
🗞️ Trump Plans To Sign Executive Order On The Psychedelic Ibogaine As Soon As This Week, Report Says
— The Dales Report (@TheDalesReport)
🔎 "Citing two sources, CBS reported that the president’s move could come within days."
🌿 ETFs 🌎 $YOLO 🇺🇸 $MSOS
📈 $SPY $QQQ $IWM #FinTwithttps://t.co/9zHrdTuhPe
BY Doug Kass · Apr 16, 2026, 12:59 PM EDT
We’re relaunching cannabis coverage next week on 4/20, and one of the names we’ve been tracking, Decibel $DB $DBCCF, just printed results that are hard to ignore.
— Jonesy (@HedgeyeDJ)
While it’s obviously too small for most institutions, the results are nonetheless noteworthy and speak to an…
BY Doug Kass · Apr 16, 2026, 12:25 PM EDT

BY Doug Kass · Apr 16, 2026, 12:17 PM EDT
There is no reason why the Israel/Lebanon ceasefire doesn't add to the buying, which is now in its 13th consecutive day.
BY Doug Kass · Apr 16, 2026, 11:48 AM EDT
- NYSE volume 6% below its one-month average;
- Nasdaq volume 34% above its one-month average;
- VIX index: up 4.84% to 19.05
None.
BY Doug Kass · Apr 16, 2026, 11:30 AM EDT
From Peter Boockvar:
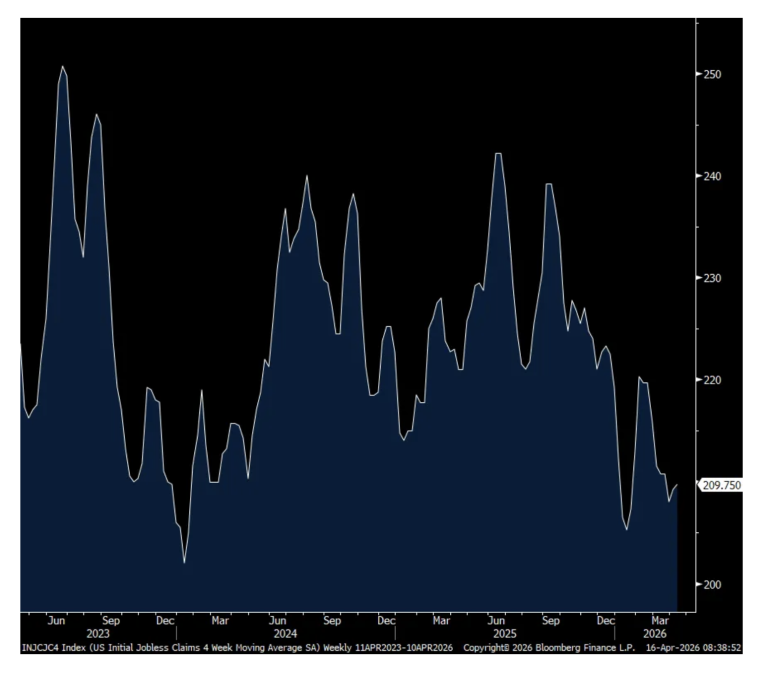
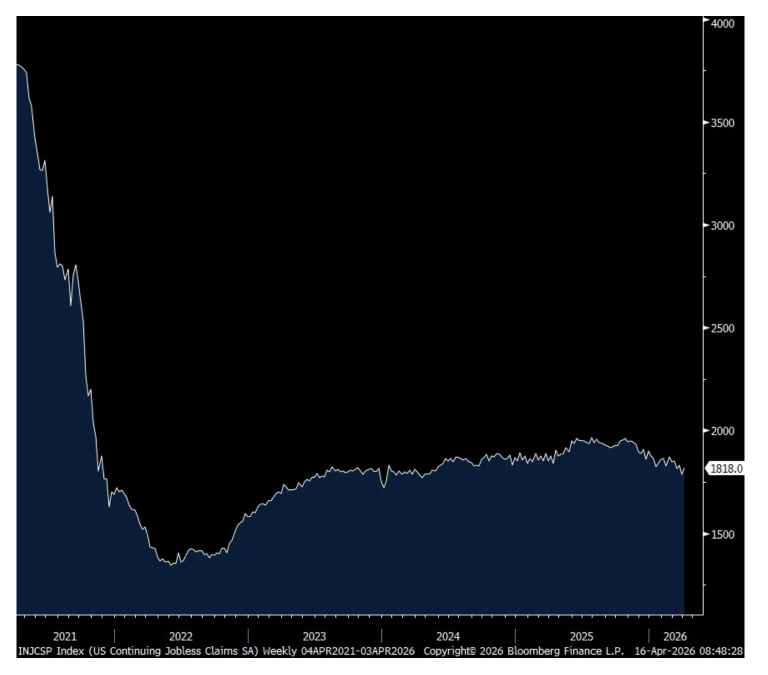
Initial jobless claims for the week ended 4/11 fell to 207k from 218k but the 4 week average was 210k vs 209k last week because a print of 205k fell out from 5 weeks ago. Continuing claims lifted back above 1.8mm at 1.818mm but still remaining below the 1.9mm range which has been the upper end of the range since November 2021. Again, are these people seeing benefits expire or are they finding new jobs. Likely a combination while the pace of firings, as measured here, remain muted.
4 Week Avg Initial claims
Continuing Claims
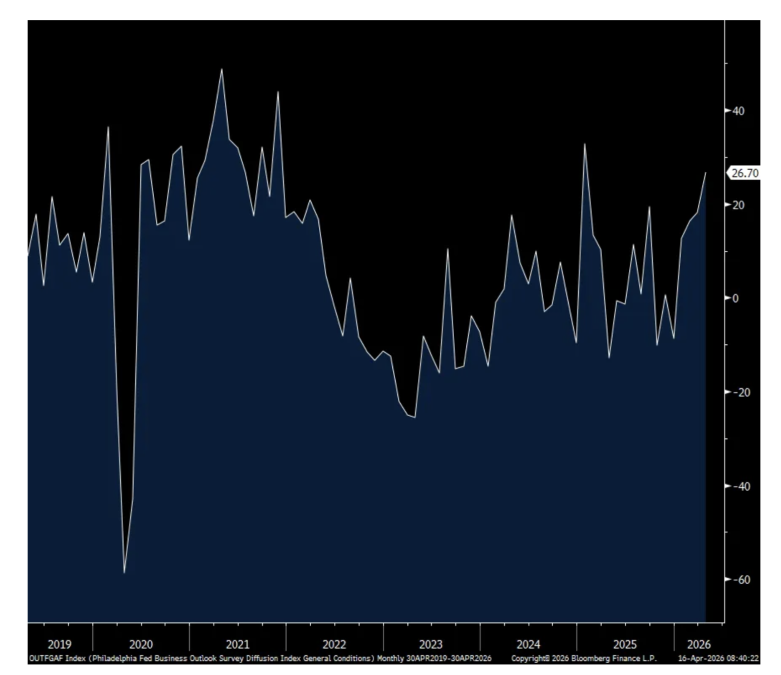
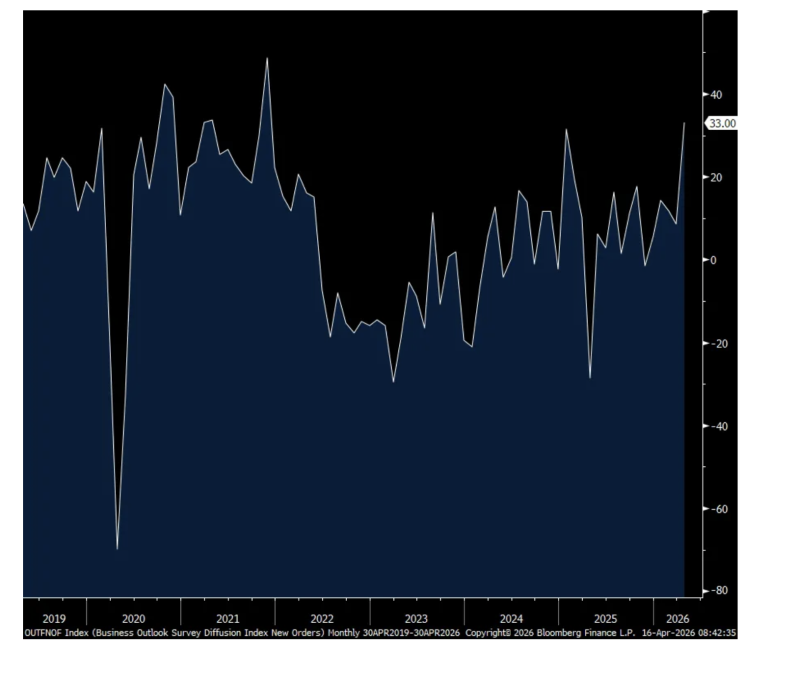
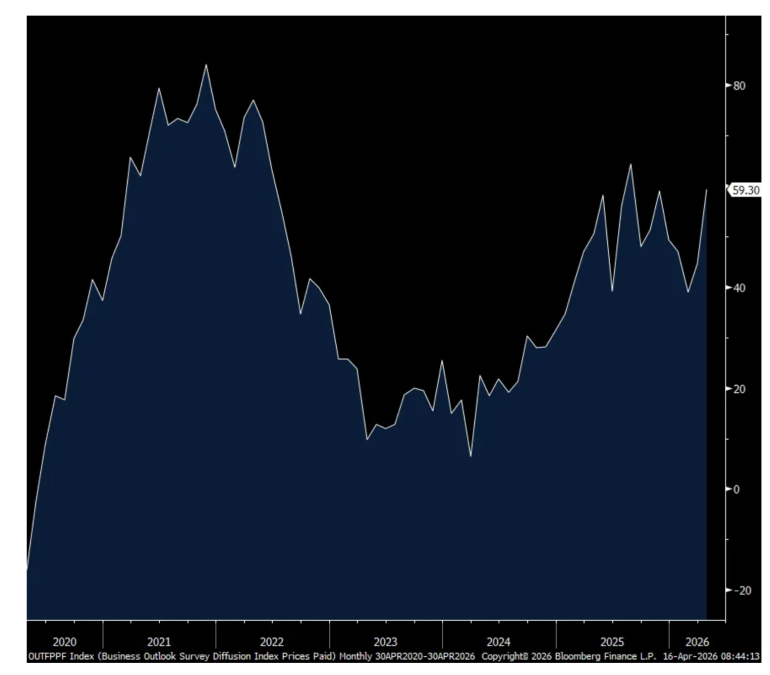
After the positive read seen in the NY manufacturing index, the April Philly index rose to 26.7 from 18.1 and above the estimate of 10. As also seen in the NY survey, new orders jumped to 33 from 8.6 and I continue to believe that we have companies that are front running ordering in order to create extra inventories so as not get caught short on any supply shortages.
Backlogs remained deeply negative at -10.2 and hasn’t been above zero since last July. Inventories at -1.9 is the set up for an increase. Employment fell back under zero at -5.1 but the workweek improved.
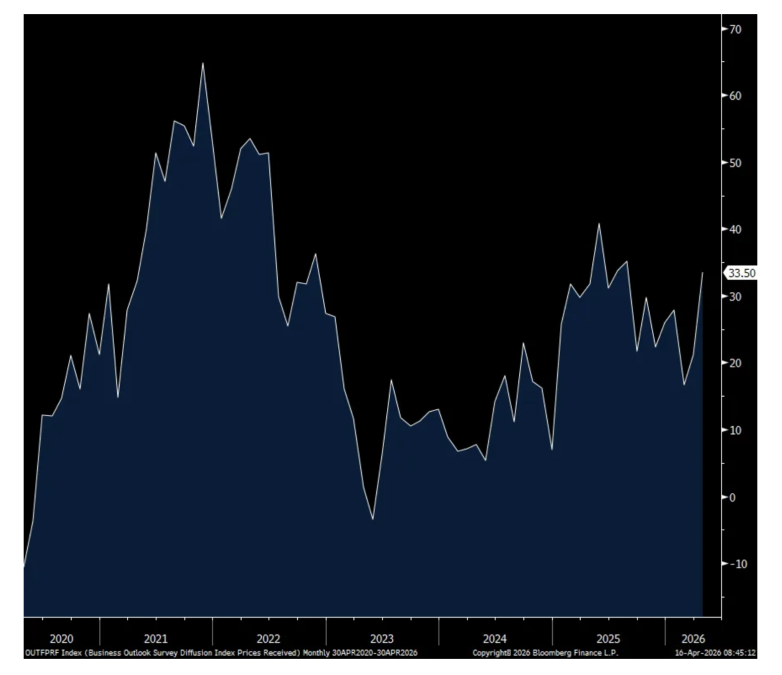
Not surprisingly, prices paid jumped to 59.3 from 44.7 and that is the most since last August. Prices received also rose to the highest since August at 33.5 vs 21.2 in the month before.
As for the six month business outlook, it was little changed at 40.8 vs 40 and holding up much better than the outlook seen in the NY index. Also, capital spending plans rose by about 10 pts vs the drop in the NY region.
Bottom line, manufacturing seems to be putting in a bottom but I’ll argue, for now, restocking inventories is the main reason.
Speaking of NY, the NY Fed’s services index for that region remained in contraction at -14 but less so and vs -22.6 in March.
Philly Mfr’g
New Orders
Prices Paid
Prices Received
Positions: None.
BY Doug Kass · Apr 16, 2026, 10:30 AM EDT
* The market is balancing on a few stilts, hoping nobody notices (the high wire act)
* It is Tom Lee's world...
This week I sold out the balance of all of my technology ( (AMZN) , (META) , (MSFT) , (GOOGL) ) and financial longs ( (BAC) , (C) , (WFC) , (AXP) , (MS) ) on substantial strength.
As I mentioned late in the day, the market's leadership has again narrowed. To wit, (IWM) (Russell) and (RSP) (equal-weighted S&P) barely budged on Wednesday and breadth was nothing to write home about (particularly as it relates to the large jump in the senior averages):
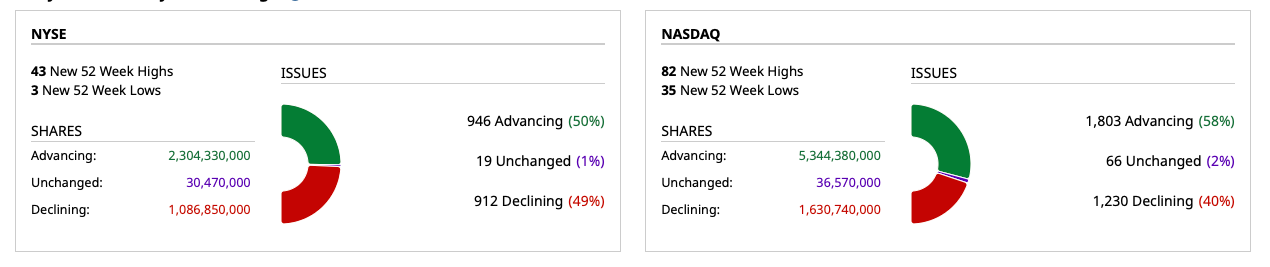
But such a divergence has happened often in recent advances. It's not my father's market!
Here is more from Quoth The Raven:
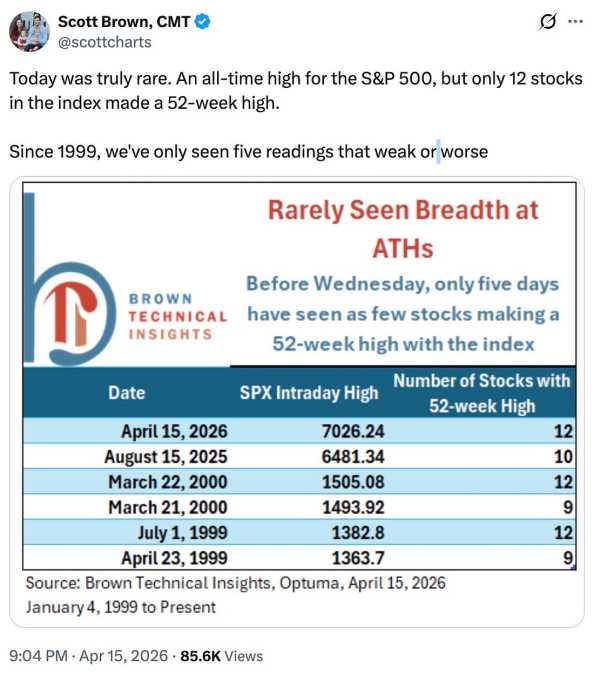
Only 12 stocks in the entire index managed to make a 52-week high. Twelve. Out of five hundred. If that sounds absurd, it should.
And it’s not just rare, it’s almost unheard of. Going back to 1999, there have only been a handful of similar readings: August 2025 saw just 10 stocks at new highs, and then you have to go all the way back to the late-1999/early-2000 period to find anything comparable, with counts between 9 and 12.
In other words, this isn’t normal “strong market” behavior. This is the kind of thing that shows up a few times per generation.
What it means is that the market’s headline strength is doing a very good job of hiding what’s actually going on underneath the surface. In a healthy rally, you’d expect a wide swath of stocks to be participating, with dozens if not hundreds pushing to new highs alongside the index. That’s how bull markets are supposed to work.
Instead, what you have here is the opposite: the index is making new highs while almost everything else is… not. Most stocks are lagging, drifting, or already rolling over. So when you hear “the market is at all-time highs,” what that really translates to is “a small handful of stocks are doing all the work while the rest are along for the ride.”
As most of you already know, the reason this sleight of hand is even possible comes down to how the S&P 500 is built. It’s market-cap weighted, which is a polite way of saying the biggest stocks get to call the shots. If a few mega-cap names decide to go on a tear, they can drag the entire index higher whether the other 490 stocks feel like cooperating or not.
Add in a market that’s obsessed with a narrow set of narratives and flush with passive flows that automatically funnel money into those same giants, and you get exactly this outcome: a rally that looks powerful on the surface but is being carried by a very small, very crowded group of leaders.
That’s what makes the move so thin. There’s no depth to it. When only a dozen stocks are making new highs, you’re not looking at broad demand—you’re looking at concentration. And concentration cuts both ways. It works great on the way up, right until it doesn’t.
Because when leadership is this narrow, the entire market becomes dependent on those few names continuing to go up indefinitely, which, history suggests, is not a particularly reliable plan. If they stall, there isn’t a long line of other stocks ready to pick up the slack.
And yes, the historical comparison everyone is quietly thinking about is the late 1990s, because that’s the last time you saw this kind of extreme narrowness at new highs. Back then, a small group of tech stocks carried the index while breadth deteriorated underneath, right up until it mattered.
That doesn’t mean the same outcome is guaranteed now, but it does mean this isn’t some random quirk of market data. It’s a pattern, and it tends to show up when markets are getting a little too comfortable relying on the same winners over and over again.
The tricky part is that this kind of environment can keep going longer than it probably should. As long as the leaders keep working, the index can keep printing new highs, and the illusion holds. But it’s still an illusion.
Underneath, the market is getting narrower, more dependent, and more fragile by the day. An all-time high with only 12 stocks participating isn’t broad strength—it’s a market balancing on a few very expensive stilts and hoping nobody notices.
As noted yesterday I don't see another sustainable bull market leg for these five reasons (among others) on top of the recent gains:
5 Reasons Why Investors' Optimism (and Recent Higher Stock Prices) May Be Wrong
* Bulls cite about +17% growth in S&P 2026 EPS. However, taking out Micron (MU) and Nvidia (NVDA) , brings aggregate EPS growth to only a high-single-digit increase. Good, but not great and likely not suggestive of a broadening in the recent market advance.
* Since the start of the Iran War the prices of "stuff" have materially risen (while the S&P Index is +1%). As seen in the recent PPI release, pipeline inflation remains robust:
Sulfur: +67%
Jet Fuel: +66%
Urea: +51%
Diesel: +50%
Heating Oil: +40%
WTI Crude Oil: +37%
European Natural Gas: +34%
Gasoline: +32%
Fertilizer: +31%
Brent Crude Oil: +31%
Coal: +14%
Palm Oil: +10%
Iron Ore: +7%
Rice: +4%
* The Federal Reserve's hands are tied. The Fed is not in a position to do much about either inflationary or recessionary pressures. As inflation will likely be higher for longer, the Fed cannot be restrictive (in order to dampen those higher costs/prices). Not only is the Administration putting pressure on the Fed to lower interest rates (and would be vocally resistant to implementation of rate increases) but the staggering U.S. debtload and out-of-control deficit limit the ability to tighten. Meanwhile, if the economy weakens — given the cost of war, lower consumer and business confidence and the likely reemergence of inflation — the Fed is not in a position to loosen in order to stimulate economic growth.
* Improvisational foreign and domestic policy may be destabilizing to confidence and economic growth. Iran took us to a worrisome precipice — will there be more Irans... with more dire consequences?
* The AI malinvestment, the secular threat to software and private credit issues have not yet been resolved.
BY Doug Kass · Apr 15, 2026, 7:30 AM EDT
***
Unfortunately, I have been wrong for the last 10 days to two weeks.
Mr. Market doesn't read my Diary nor does it care about my market view. Machines and algos move on momentum and not analysis. Quants care little about "value."
For now, stock futures point to another good opening - to add to the near record skein of "up" days in the Nasdaq.
Party time. Wayne’s World Party Time Excellent 3
Position: Short SPY common (S), QQQ common (S)
BY Doug Kass · Apr 16, 2026, 9:55 AM EDT
From Peter Boockvar:
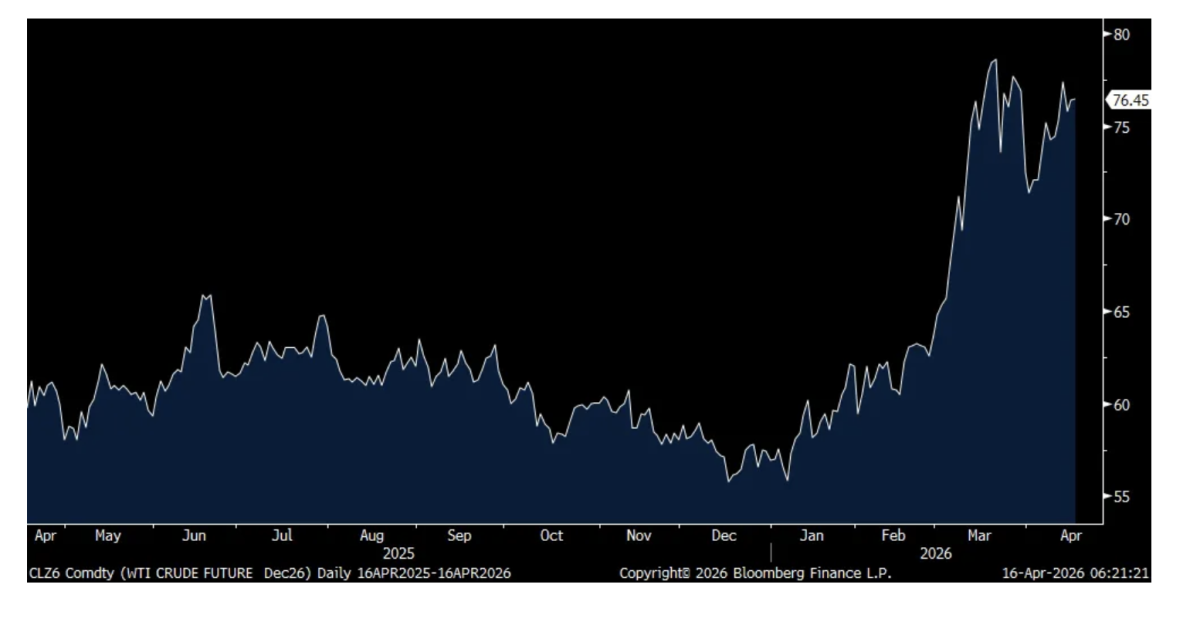
As we mostly focus on the front month futures contract and we await the finality to the war and a full reopening of the Strait, I will mention the December contract which stands at about $76.50 as of this writing, about $2 off the mid March high. I do because of what the CEO of Diamondback Energy said yesterday. “I don’t think the numbers we’re seeing on the screen and what the market’s telling us is the reality of where this is headed. Our board is kind of seeing this as a bigger problem maybe than the market’s saying, and the back end of the curve might be kind of lying to us a little bit.” We remain long energy stocks, acknowledging a further pullback upon cessation of the war but believing a much higher low in price is here to stay for a while.
December WTI Futures Contract
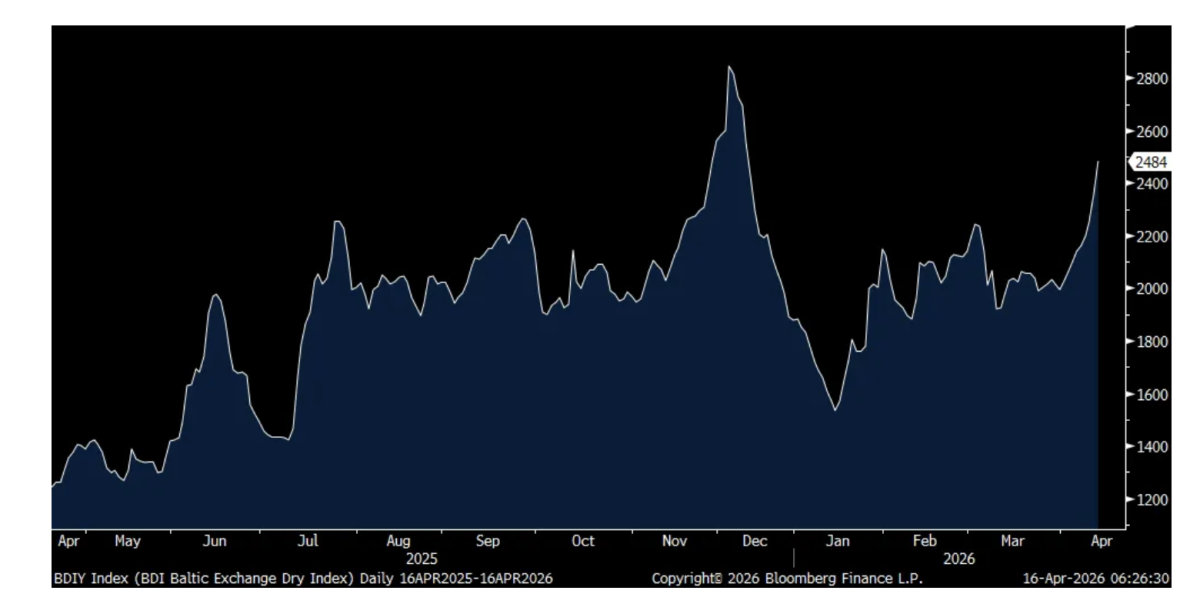
Container shipping prices according to the World Container Index were down w/o/w with the Shanghai to LA route down 3.4% w/o/w after jumping by 9% last week. Shanghai to NY slipped 3% after a 32% rise over the prior six weeks. The price was also down for the Shanghai to Rotterdam trip. On the flip side, dry bulk shipping prices rose for the 9th straight day by another 5.5% to 2,484, the highest since December according to the Baltic Dry Index.
Baltic Dry Index
This was an interesting stat on Q1 earnings that I read in the FT yesterday. According to Deutsche Bank, of the about 12% earnings growth expectations, 6 percentage points of the increase are from just Nvidia and Micron.
This is how the Fed’s Beige Book summarized the US economy over the past six weeks, “Overall economic activity increased at a slight to modest pace in eight of the twelve Federal Reserve Districts, while two Districts reported little change and two Districts reported slight to modest declines. The conflict in the Middle East was cited as a major source of uncertainty that complicated decision-making around hiring, pricing, and capital investment, with many firms adopting a wait-and-see posture.” Quite the mixed bag.
After about three years of contraction, “Manufacturing activity rose slightly to moderately in most Districts.”
As we’re in the midst of bank earnings, “Banking sector activity was generally steady with loan demand stable to up moderately.”
On the biggest contributor to GDP growth it remains a very uneven situation, “On balance, consumer spending increased slightly despite harsh winter weather in some regions and higher fuel prices. Many Districts continued to report signs of consumer financial strain, increased price sensitivity, and rising demand at food banks and other social service organizations, while spending among higher-income consumers was resilient.”
With respect to real estate, “Housing market activity softened across several Districts as heightened uncertainty and rising mortgage rates dampened buyer demand. Commercial real estate markets improved, with strength in industrial properties, especially data center projects. Office markets saw solid demand for Class A space but weaker demand for lower-tier properties.”
And on the outlook, “Business outlooks varied amid widespread uncertainty about future conditions.”
With regards to the labor market, “On balance, employment was steady to up slightly during this reporting period, though one District noted a slight decline. Most Districts described labor demand as stable, with low turnover, minimal layoffs, and hiring mostly for replacement. Several Districts noted increased demand for temporary or contract workers, as firms remained cautious about committing to permanent hires. Many Districts reported that labor availability had improved, although difficulty finding some skilled workers, especially in the skilled trades, persisted. While most Districts indicated that AI had not yet significantly impacted overall staffing levels, some noted that AI-driven productivity improvements had enabled many firms to delay or reduce hiring.”
And on pay, “Wages generally continued to rise at a modest to moderate pace. Some Districts noted continued wage pressures for some roles in health care and the skilled trades, though overall wage competition remained muted.”
Price pressures intensified in certain spots though not everything is flowing completely through to the consumer, “Price growth mostly remained moderate overall, with the vast majority of Districts reporting moderate increases and others pointing to modest growth. Generally, input cost increases outpaced selling price growth, compressing margins. Energy and fuel costs rose sharply in all Districts, attributed to the Middle East conflict, leading to higher freight and shipping costs and higher prices for plastics, fertilizers, and other petroleum-based products. Input cost pressures beyond energy-related increases were also widespread. Several Districts reported rising prices for metals due to tariffs, such as steel, copper, and aluminum. Technology costs rose for both hardware and software. Insurance premiums and health care costs continued to climb.”
JB Hunt is trading up a bit pre market after earnings as they are benefiting from the firming up of trucking price and they said this of note:
“As we moved through the first quarter, the freight environment felt meaningfully different than what we’ve operated in over the past several years. When we spoke last quarter, I described the truckload market as fragile, and that we are testing the elasticity of supply, and that assessment proved accurate. Continued regulatory enforcement to improve safety in our industry has removed non-compliant capacity, and when combined with early signs of improved demand, resulted in a tighter truckload market throughout the quarter. While predicting inflection points is never precise, we believe we are on a path of recovery.”
More on the capacity shrink that continues, “What we’re seeing is a freight market that has fundamentally less slack than it did in prior cycles. Capacity has been steadily exiting for an extended period, driven by regulatory enforcement, rising costs, and financial performance that does not support capital reinvestment...Truckload rates, tender rejections, the ISM PMI, and several others are all at their highest levels since 2022. And trucking employment is at the lowest levels since 2022, all proof points of structural change.”
“We also saw volatile fuel prices. Our business and our industry have fuel surcharge programs that protect our operations from fluctuations in fuel markets...It’s worth reminding our investors, fuel is generally a pass through expense and typically has a small impact on profit dollars quarter-to-quarter. However, it is dilutive to overall margins.”
From Bank of America and whose stock traded higher after earnings:
“Turning briefly to asset quality, we saw improvement from last year. Net charge-offs, card delinquencies, reservable criticized assets, and non-performing loans, all declined vs the first quarter of ‘25. Provision expense was $1.3 billion compared to $1.5 billion last year, reflecting continued benign credit results.”
“Our research team continues to see an economy that is resilient, that the core activities of the economy continue to push along even with all the uncertainty that you’ve all written about out there. We see the forward look of GDP growth rates in the US in the 2% range, and we see a faster growth rate around the world.”
Talking in nominal terms, “the total spending by consumers across all the ways they move money into the US economy at Bank of America is $4.5 trillion a year. For 2025, you can see that was up 5% from 2024, and that 5% growth has been consistent in the first quarter of ‘26 compared to the first quarter of ‘25. And during the quarter, customers moved $1 trillion plus into the economy.”
“debit and credit card spending was up 6% y/o/y” again in nominal terms.
“In this environment, I’m asked if the capital markets activity has really inflected, or is this just the volatility produced in the results that our markets team produced or our investment banking team. What we’re seeing is improved breadth in our global businesses, not just episodic activity. Trading has benefited from volatility...investment banking pipelines are building and engagement is up across all products. The tone of our corporate clients is strong. While they wonder about all the things I spoke about earlier, they continue to conduct strong activity.”
On the regional bank side, this was the macro view from M&T Bank on their call and whose stock traded off by 1.5%:
“The economy continues to hold up well despite the ongoing concerns and uncertainty regarding tariffs and other policies. The situation in Iran poses new risks to the US and global economies through energy prices and uncertainty. Consumer spending has slowed but continues to grow in aggregate. However, there is a growing divide between higher and lower income households, often called the K-shaped economy. The higher end consumer continues to be stronger and is spending, while the lower end consumer has not declined but maintained and is vulnerable to the risks in the environment.”
On credit spreads in C&I and CRE, “Credit spreads are moving around a little bit. With the conflict in Iran, they probably widened out a touch, a little, from that perspective. But it’s also very competitive, so sometimes it’s a little wider, sometimes a little narrower. It’s probably net-net about the same would be my take right now. But we try to be competitive and want to make sure we get paid for the risk that we’re taking at the end of the day.”
Taiwan Semi is trading down after reporting earnings that looked good. They said:
Understanding where the strength is coming from, of course data center construction, I’ll highlight here how they are maneuvering their supply chains in the current geopolitical environment. “In terms of material supply, TSMC’s strategy is to continuously develop multi-source supply solutions to build a well diversified global supplier base and to improve the local supply chain. For specialty chemicals and gases, including helium and hydrogen, we source from multiple suppliers in different regions, and we have prepared safety stock inventory on hand. We are also working closely with our suppliers to further strengthen the resiliency and sustainability of our supply chain. Thus, we do not expect any near term impact on our operations from material supply.”
On the energy procurement side, “TSMC worked closely with Taipower and the Taiwan government to ensure a stable and sufficient energy supply. With the recent situation in the Middle East, the Taiwan government has announced it has secured sufficient LNG supply through at least May. The government has also said it is actively working on securing further LNG supply, diversifying sourcing to other regions and other power backup plants. Therefore, we do not expect any near term disruption or impact to our operations.”
China’s economy grew by 5% y/o/y in Q1 vs the estimate of 4.8% with strength in industrial production. Retail sales remain lackluster as the consumer is still managing the decline in residential real estate prices. Though prices are falling at the slowest pace in a year and are now rising m/o/m in Shanghai, Shenzhen and Guangzhou while flat in Beijing vs continued declines in 2nd and 3rd tier cities. Getting close to the bottom I believe, which will in turn help consumer spending from here.
We continue to own and like some stocks in Hong Kong and remain optimistic generally about markets overseas like Singapore, Vietnam, India and Brazil in particular. We also continue to find cheap stocks in Europe. Local currency emerging market bonds are also a foreign holding.
Before the war, the UK economy in February grew .5% m/o/m, well better than the estimate of up .1% with help from services and construction. Of course, how it reacts to the war and the supply and commodity situation is all that matters now.
The ECB meets a day after the Fed in a few weeks and Bloomberg News is reporting that “Policymakers at the ECB are leaning toward keeping interest rates unchanged this month, postponing their verdict on whether the fallout of the Iran war warrants a response, according to people familiar with the debate.”
More, “tighter financing conditions are helping to keep inflation expectations anchored for the moment, the people argued, adding that a rate hike wouldn’t necessarily alter market pricing much.”
The euro is down slightly after an 8 day rally and European bond yields are lower in response. Stocks in the region are higher again.
None.
BY Doug Kass · Apr 16, 2026, 9:35 AM EDT
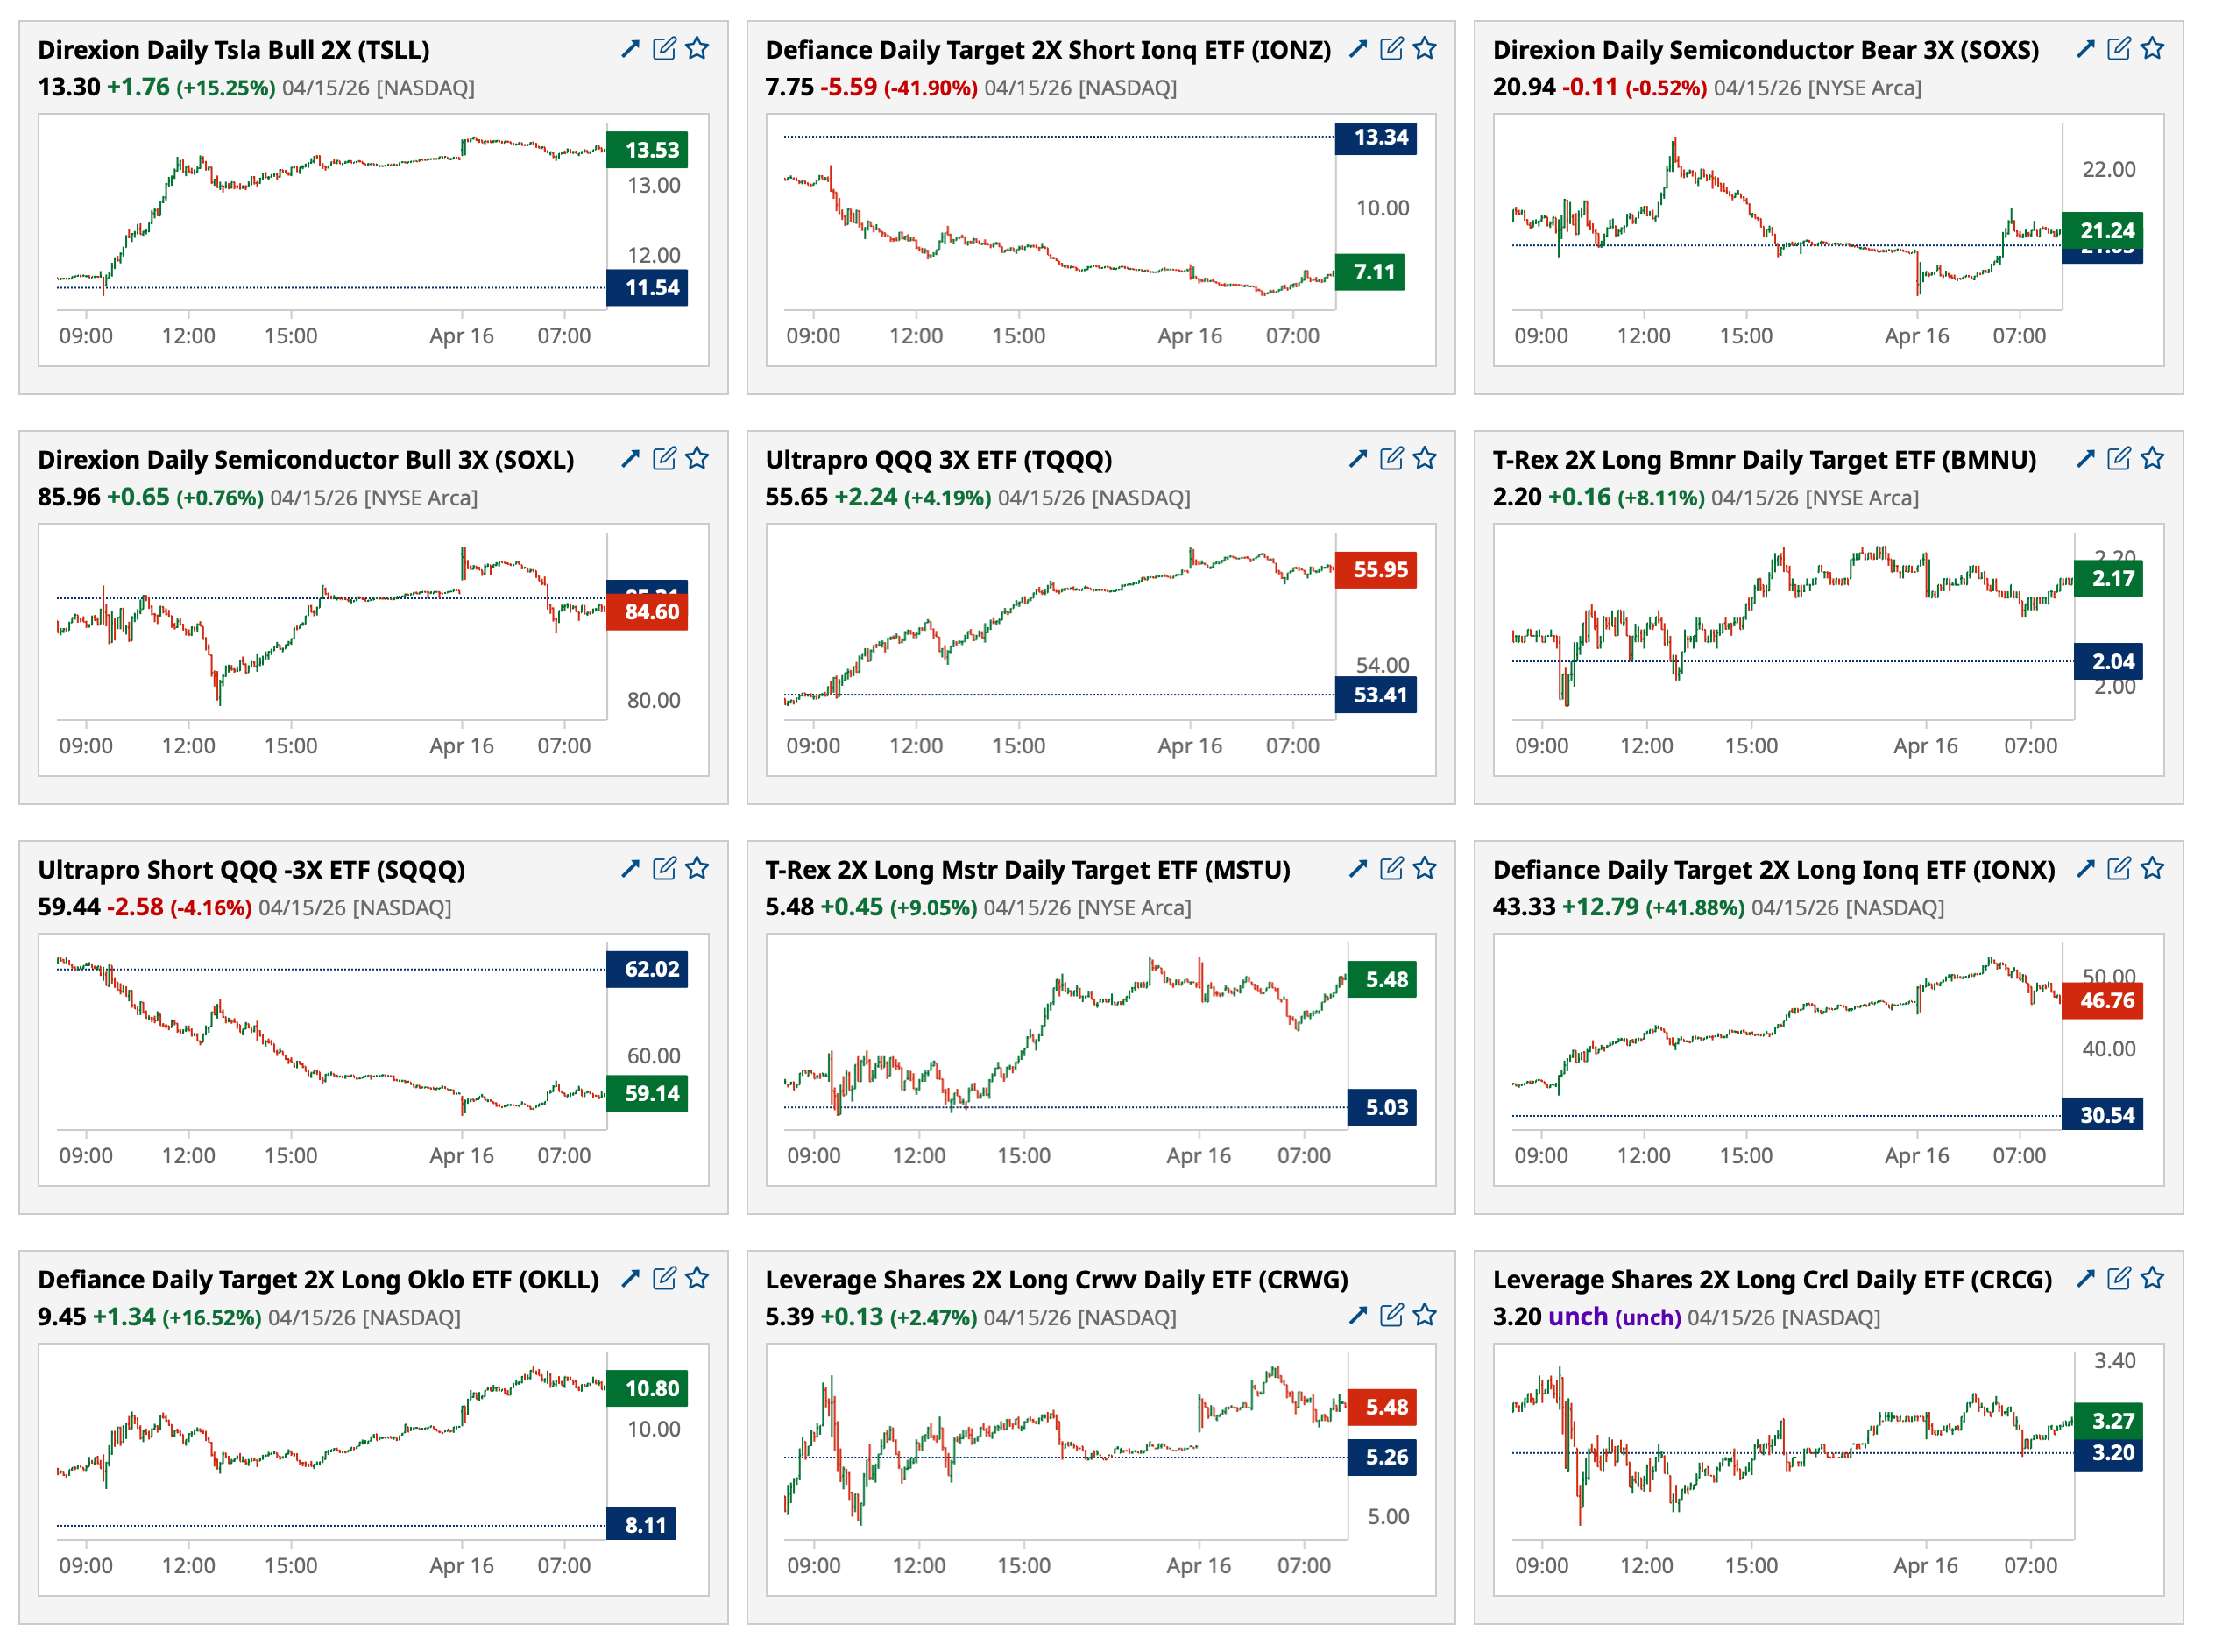
-AEHR +15% (receives record $41M follow-on AI burn-in order)
-ALGS +14% (enters Exclusive License Deal with Xiamen Amoytop Biotech Co., Ltd. to Develop and Commercialize Pevifoscorvir Sodium in Greater China for Chronic Hepatitis B Virus Infection)
-SMR +9.7% (nuclear, uranium company strength after White House releases rules or establishing a national initiative for American Space Nuclear Power)
-VOYG +8.5% (signs NASA order for seventh private astronaut mission)
-HIMS +7.8% (FDA plans meetings to decide on potential loosening restrictions on certain peptides)
-NNE +7.0% (nuclear, uranium company strength after White House releases rules or establishing a national initiative for American Space Nuclear Power)
-OKLO +7.0% (nuclear, uranium company strength after White House releases rules or establishing a national initiative for American Space Nuclear Power)
-PPG +5.6% (earnings, color; raises prices across products)
-ORCL +4.3% (Oracle and AWS collaborate to expand Multicloud Networking)
-IONQ +2.7% (quantum sector strength)
-JBLU +2.5% (hearing upgraded at Seaport Research Partners)
-USAS +2.2% (reports quarterly production)
-QVCGA -69% (discloses intention to commence Chapter 11 proceedings; reports earnings)
-BIRD -20% (profit taking)
-MIND -20% (earnings)
-QDEL -18% (earnings, guidance)
-IIIN -16% (earnings, color)
-GEVO -15% (withdraws DOE loan application for ATJ-30 plant)
-MGTX -14% (prices $100M underwritten offering of 11.1M shares at $9.00/shr; reacquires bota-vec rights for X-linked retinitis pigmentosa (XLRP) from Johnson & Johnson)
-JKS -8.6% (earnings, guidance)
-ABT -4.3% (earnings, guidance)
-GLW -3.1% (JPMorgan Chase and Co Cuts GLW to Neutral from Overweight, price target: $175)
-FLUT -2.9% (CitiGroup Cuts FLTR.UK to Sell from Buy, price target: 6,800p from 15,800p)
-FHI -2.6% (JPMorgan Chase and Co Cuts FHI to Underweight from Neutral, price target: $56)
-FN -2.6% (JPMorgan Chase and Co Cuts FN to Neutral from Overweight, price target: $700)
-SCHW -2.2% (earnings, color)
None.
BY Doug Kass · Apr 16, 2026, 9:15 AM EDT
None.
BY Doug Kass · Apr 16, 2026, 8:45 AM EDT
None.
BY Doug Kass · Apr 16, 2026, 8:36 AM EDT
11:00 a.m.: Treasury announces a 6-Week and 3 and 6 month bill auction;
11:00 a.m.: Treasury announces a TIPS and Bond Auction;
11:30 a.m.; Treasury hosts an $80B 4 and a $75B 8 Week Bill Auction;
2:00 p.m.: Treasury buyback (cash mgmt)
8:35 a.m.: Fed Bank of New York President Williams (Voter) gives keynote speech before the FHLBNY 2026 Member Symposium organized by the Federal Home Loan Bank of New York, Metropolitan Club, NYC (Text and moderated Q&A expected);
10:35 a.m.: Fed Board Governor Miran (Voter) participates in conversation before the Washington Economic Festival: "Global Macro Sessions," Washington, DC (No text. Q&A from moderator. Livestreamat https://bcove.video/4mmE4y2)

None.
BY Doug Kass · Apr 16, 2026, 8:22 AM EDT
CuraLeaf buyback announced. Curaleaf Launches Share Repurchase Program - Apr 16, 2026
Long CURLF S
BY Doug Kass · Apr 16, 2026, 8:03 AM EDT
The Buffett Ratio has just hit the highest level in history:
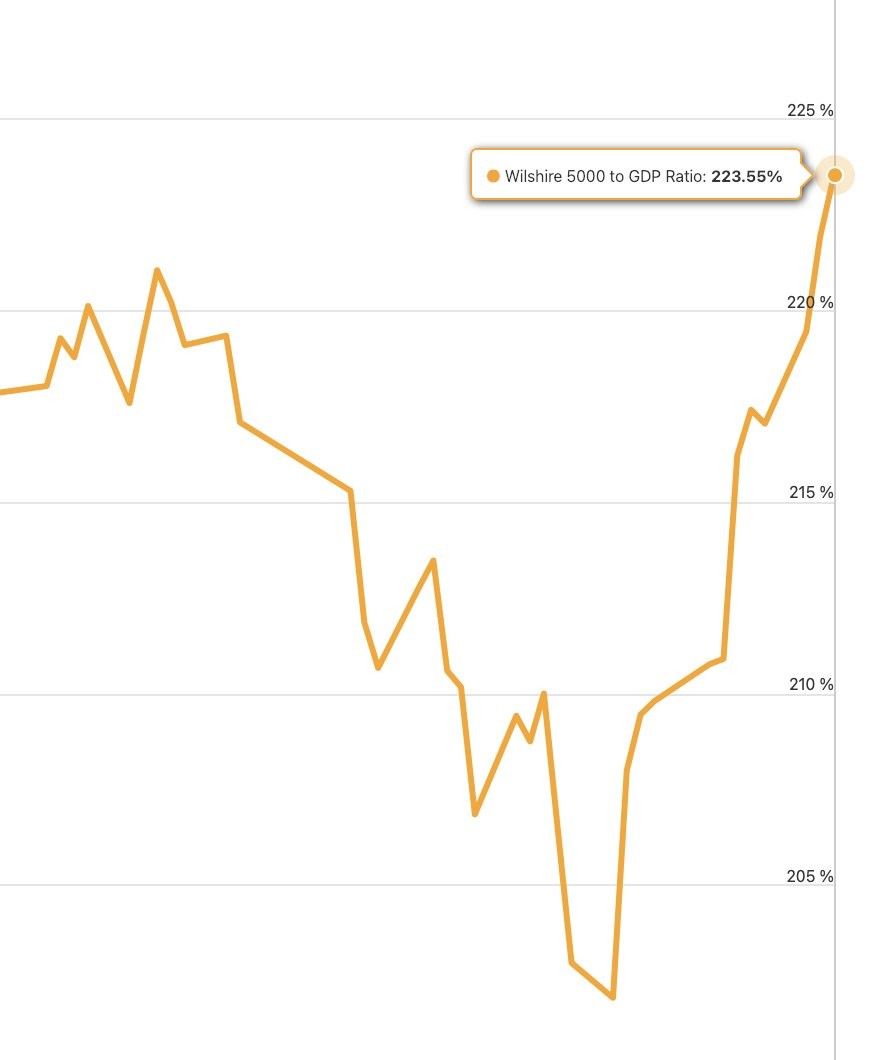
BY Doug Kass · Apr 16, 2026, 7:32 AM EDT
I have lectured in Dr. Shiller's class at Yale:
Instead of watching an hour of Netflix, watch this 1 hour Yale lecture. It will teach you more about options trading and the exact models hedge funds use than most people learn in their entire careers on Wall Street.pic.twitter.com/OaQc8wArC6
— Rony (@Ronycoder)
BY Doug Kass · Apr 16, 2026, 6:50 AM EDT
Apropos of yesterday's opening missive:
🚨 Fertilizer Prices Rise +87% YTD, Pushing Above $720 a Tonne pic.twitter.com/5eYRrPTEcA
— Hedgeye (@Hedgeye)
BY Doug Kass · Apr 16, 2026, 6:35 AM EDT
Chart of the Day: S&P 500 Rolling 10-Day Returns
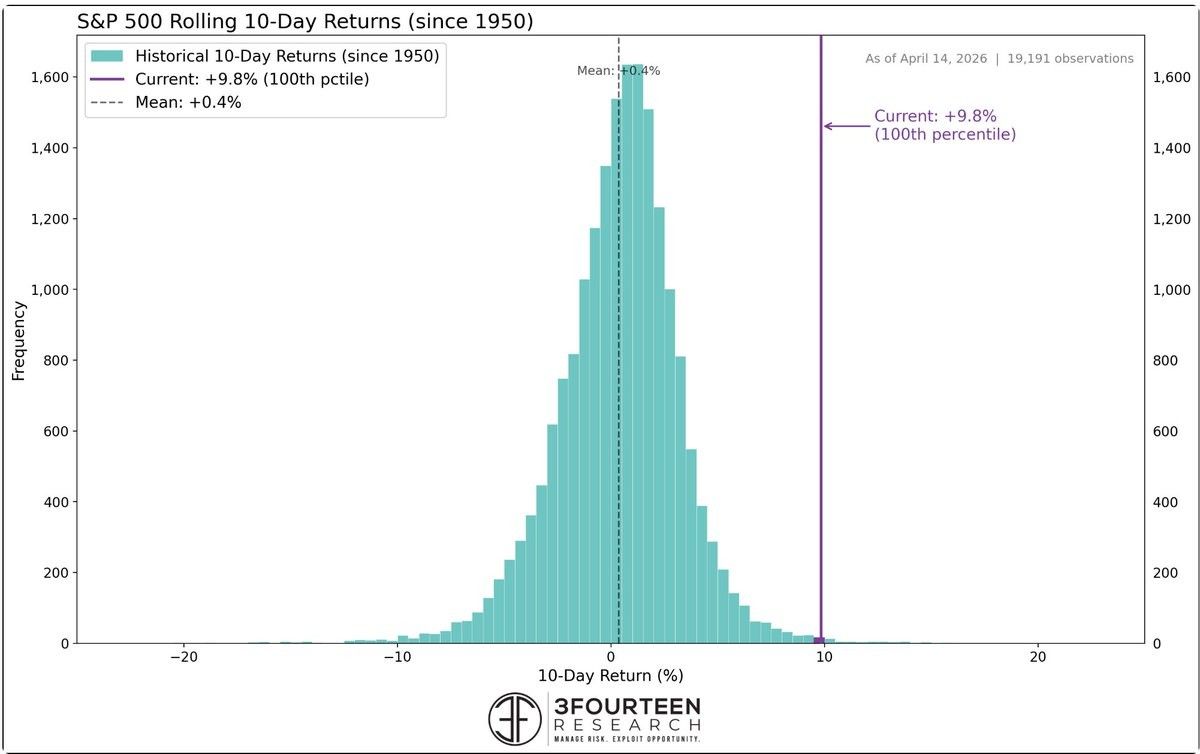
The S&P 500 just closed at new all-time highs after surging +9.8% over the past 10 sessions, placing this move in the 99.7th percentile of all 10-day returns.
Since 1950, this kind of momentum has only occurred about 20 times, with forward 12 month returns averaging roughly 19%.
Unlike prior instances that occurred within deeper drawdowns, this rally is occurring without the same level of damage, making this thrust a clear statement of underlying market strength.
The Takeaway: The S&P 500 has seen a historic 10-day rally into new record highs.
- Warren Pies (@WarrenPies) / X
In our early Monday note, we pointed out how the S&P 500 was already trading back in bullish momentum territory.
— Duality Research (@DualityResearch)
As our color-coded chart below shows, after four straight weeks in bearish momentum, price is now back above 50 on the weekly RSI — which also lines up pretty closely… pic.twitter.com/Apx4MtlxaH
RSI has gone from under 30 to over 70 in 15 days just two prior times since 1980: Nov. '16 & Aug. '82. It's not quite there yet but it's very close. $SPX $SPY pic.twitter.com/qhQVEqh9QX
— Andrew Thrasher, CMT (@AndrewThrasher)
SPX Election cycle seasonal composite. pic.twitter.com/gNj4QvZcE3
— Nautilus Research (@NautilusCap)
NASDAQ is up 11 consecutive days
— The Market Stats (@TheMarketStats)
Similar streaks of strong momentum saw $NDX finish higher 1 year later 100% of the time, with an average gain of +26%
The average maximum loss was -8% pic.twitter.com/npXSAYXkFc
Morgan Stanley is a top 5 financial by size in the $XLF ETF and notably the only one back at all-time highs today following Q1 earnings. Chart here from @IBDinvestors MarketSurge $MS #IBDPartner pic.twitter.com/zqLF3gTpro
— Evan Medeiros (@evanmedeiros)
Exxon Mobil round-trip to the beginning of Feb on both a relative and absolute basis.$XOM pic.twitter.com/zNQGYpOFME
— David Rath (@DJwrath)
BY Doug Kass · Apr 16, 2026, 6:20 AM EDT
Tom Lee has said that the war and higher oil prices is good for the markets.
Here is the alternative view:
BY Doug Kass · Apr 16, 2026, 6:05 AM EDT
The odds of Fed Chair Jay Powell leaving the Fed's board by May 30 have fallen to 31%, according to Polymarket. The chances of Kevin Warsh getting confirmed to be the next Fed chair by May 15 have fallen to a record low of 40%, despite broad support for him as a candidate. pic.twitter.com/ETZn5Fl72X
— Lisa Abramowicz (@lisaabramowicz1)
BY Doug Kass · Apr 16, 2026, 5:55 AM EDT
The S&P Short Range Oscillator remains overbought at 7.37% vs. 8.39%.
Position: Short SPY common (S)
BY Doug Kass · Apr 16, 2026, 5:45 AM EDT
The odds of Fed Chair Jay Powell leaving the Fed's board by May 30 have fallen to 31%, according to Polymarket. The chances of Kevin Warsh getting confirmed to be the next Fed chair by May 15 have fallen to a record low of 40%, despite broad support for him as a candidate.


The embedded tweet could not be found…
Blinded by and comforted by the security of higher stock prices, the parade of guests on Fin TV have become the "see no evil, hear no evil" crowd in The Bull Market of Complacency. One month ago and ten percent lower most hated the stock market. The herd knows everything about Show more
Instead of watching an hour of Netflix, watch this 1 hour Yale lecture. It will teach you more about options trading and the exact models hedge funds use than most people learn in their entire careers on Wall Street.
🚨 Fertilizer Prices Rise +87% YTD, Pushing Above $720 a Tonne

SPX Election cycle seasonal composite.

In our early Monday note, we pointed out how the S&P 500 was already trading back in bullish momentum territory. As our color-coded chart below shows, after four straight weeks in bearish momentum, price is now back above 50 on the weekly RSI — which also lines up pretty closelyShow more

Exxon Mobil round-trip to the beginning of Feb on both a relative and absolute basis. $XOM

Morgan Stanley is a top 5 financial by size in the $XLF ETF and notably the only one back at all-time highs today following Q1 earnings. Chart here from @IBDinvestors


