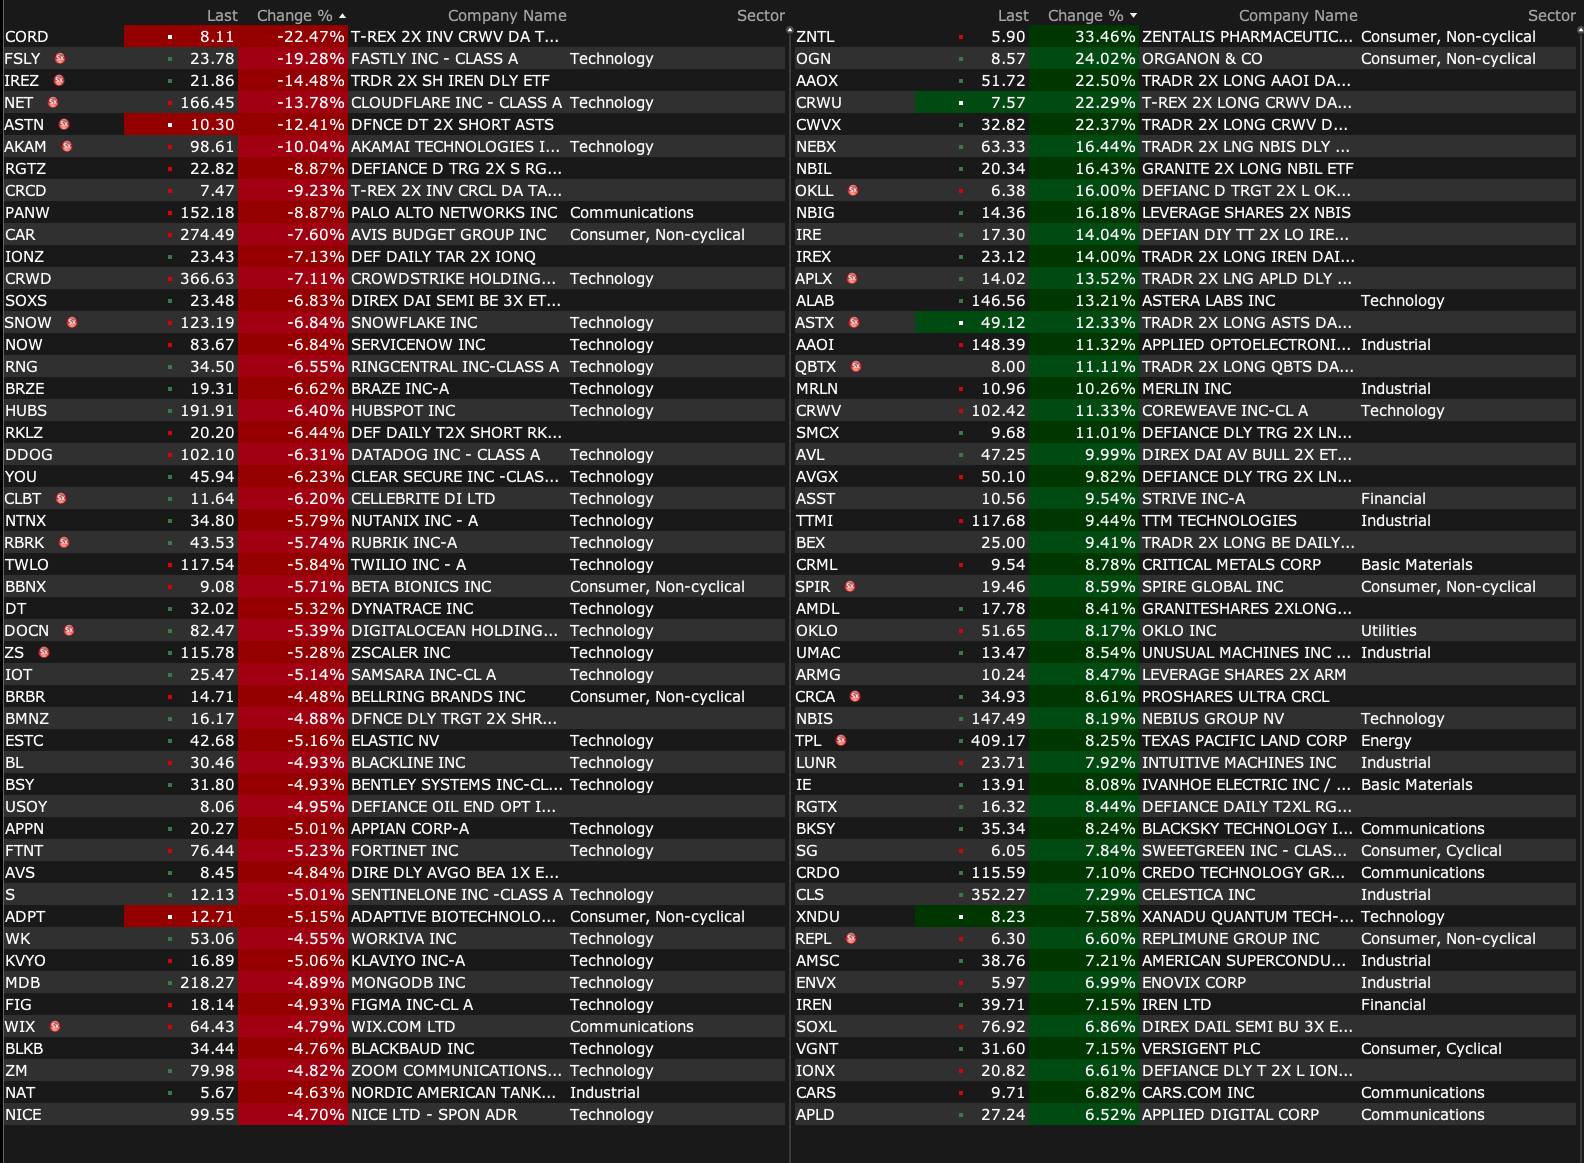
Friday's After-Hours Advancers and Decliners
After-Hours % Advancers
After Hours % Decliners
BY Doug Kass · Apr 10, 2026, 4:50 PM EDT
After-Hours % Advancers
After Hours % Decliners
BY Doug Kass · Apr 10, 2026, 4:50 PM EDT
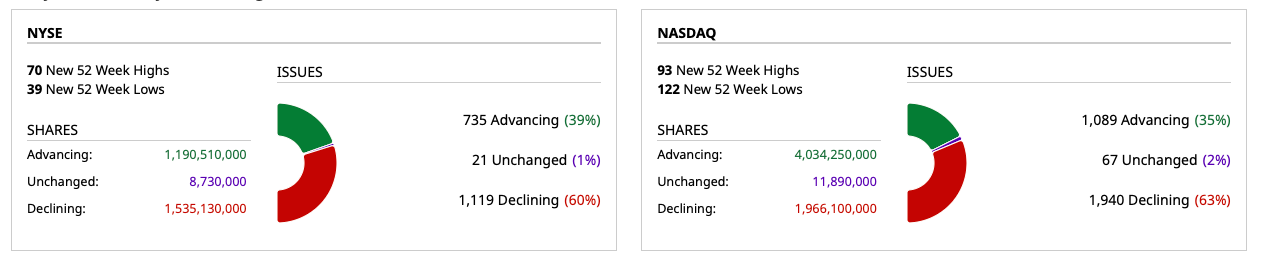
Closing Volume
- NYSE volume 25% below its one-month average
- NASDAQ volume 2% above its one-month average
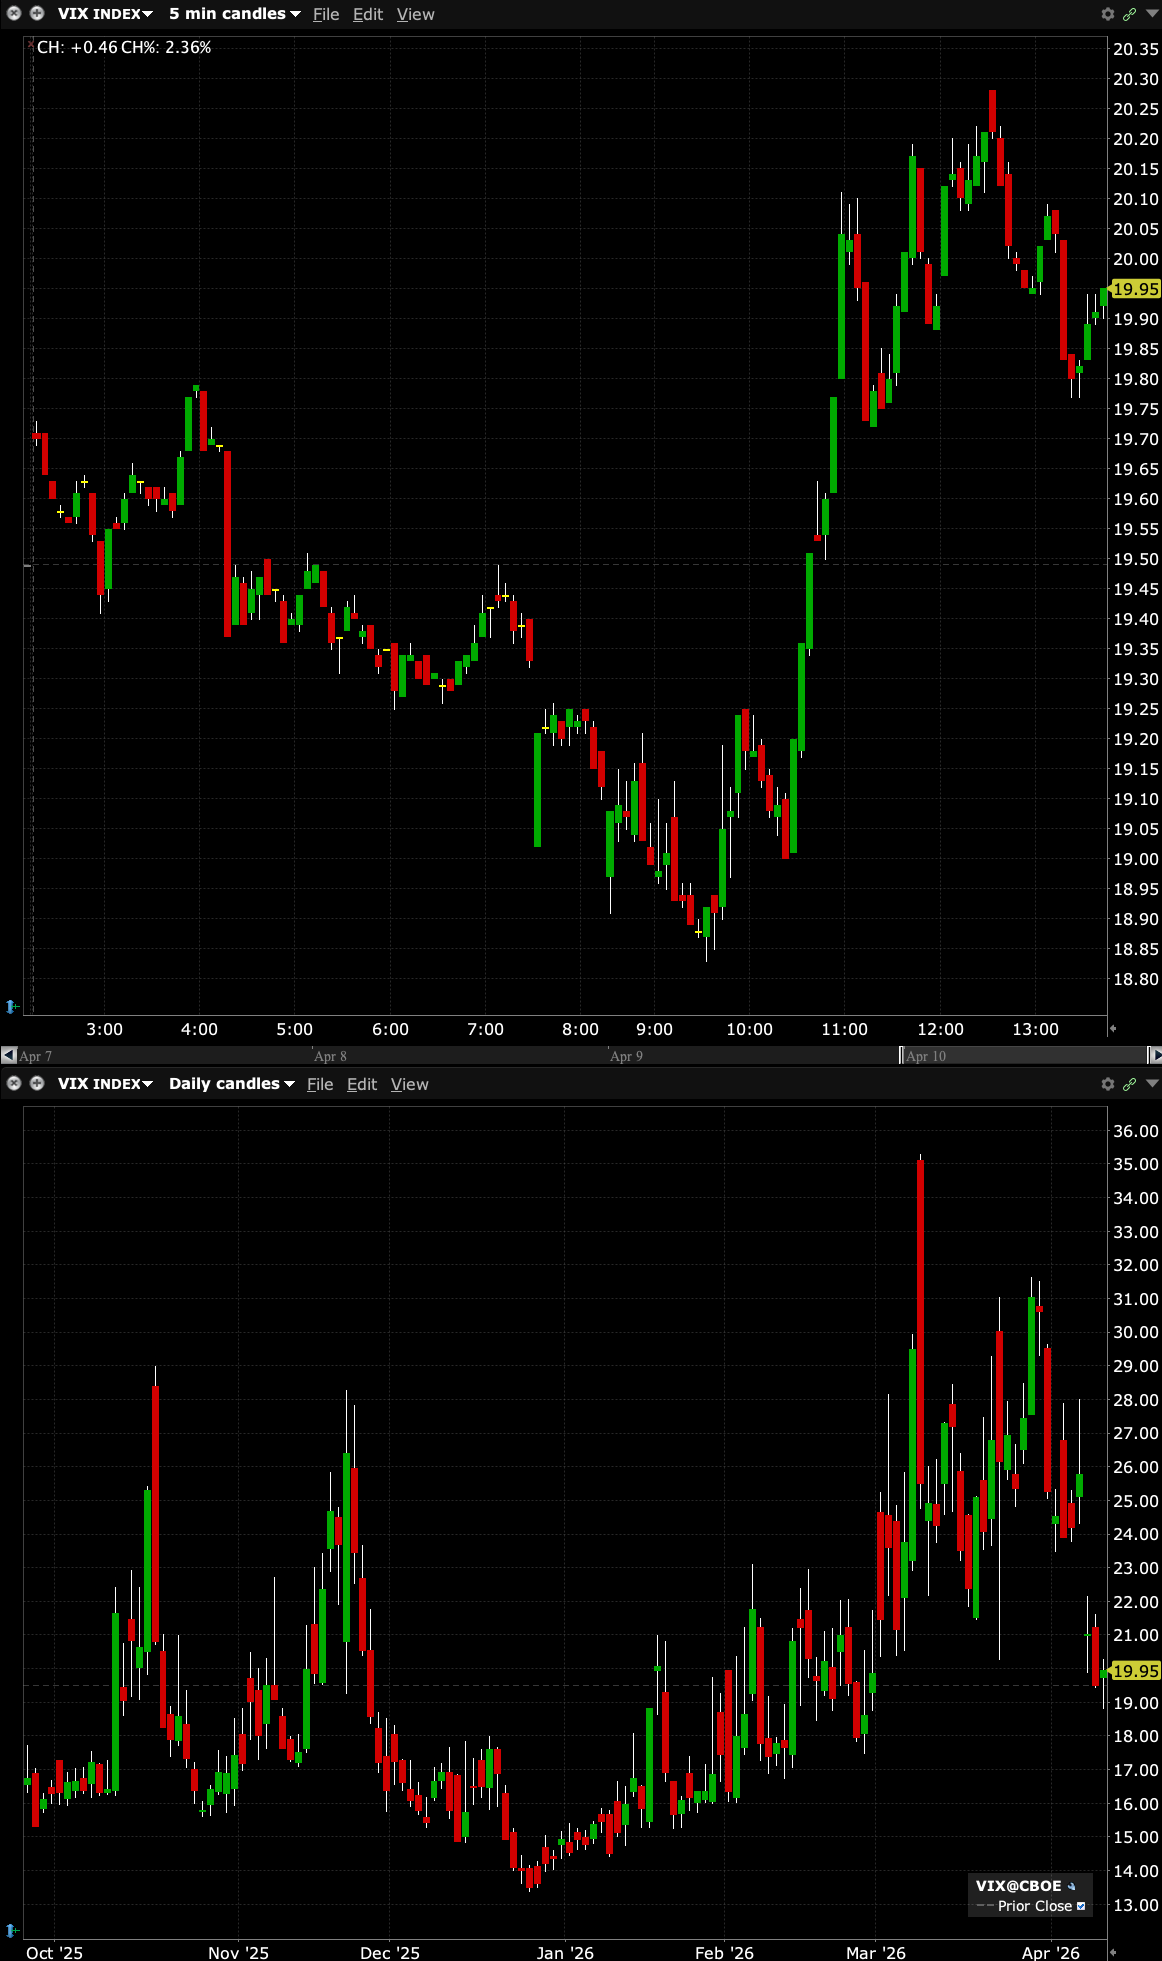
- VIX index: down 1.08% to 19.28
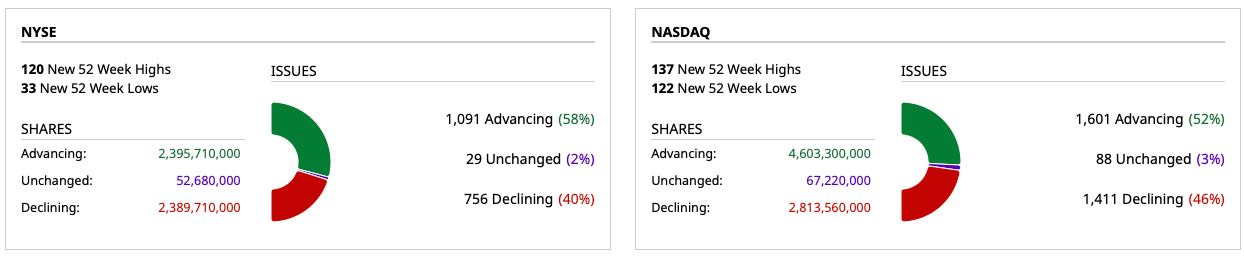
Breadth
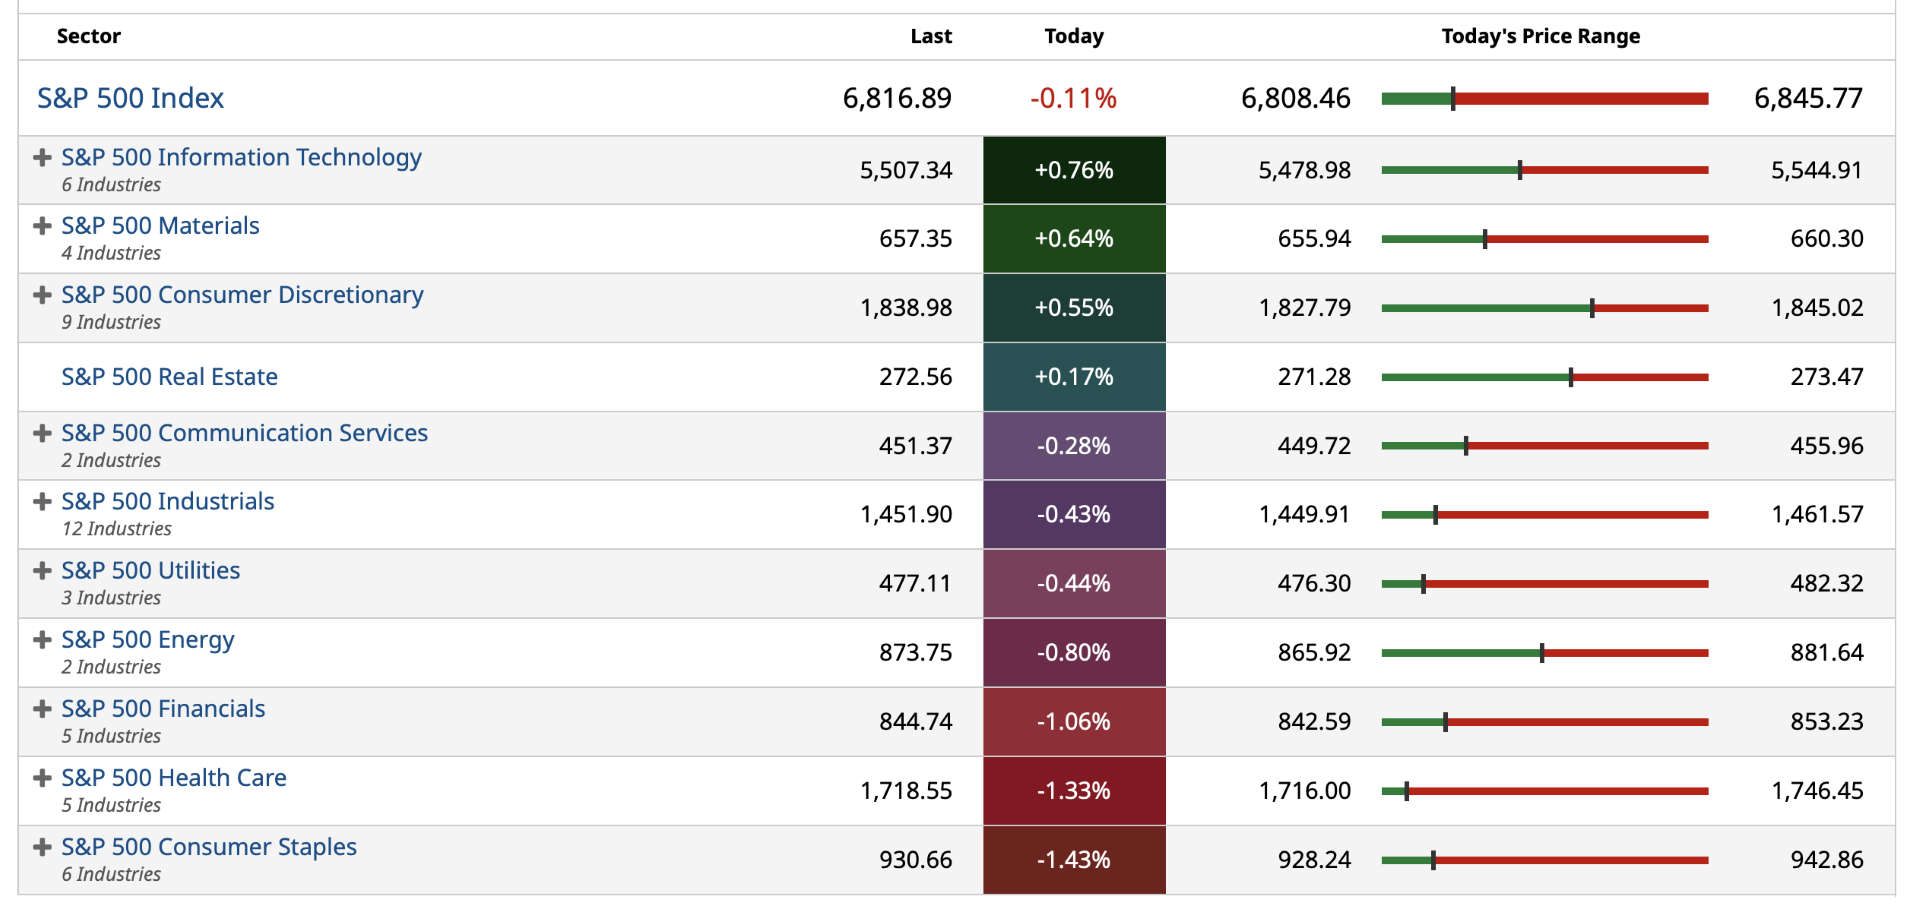
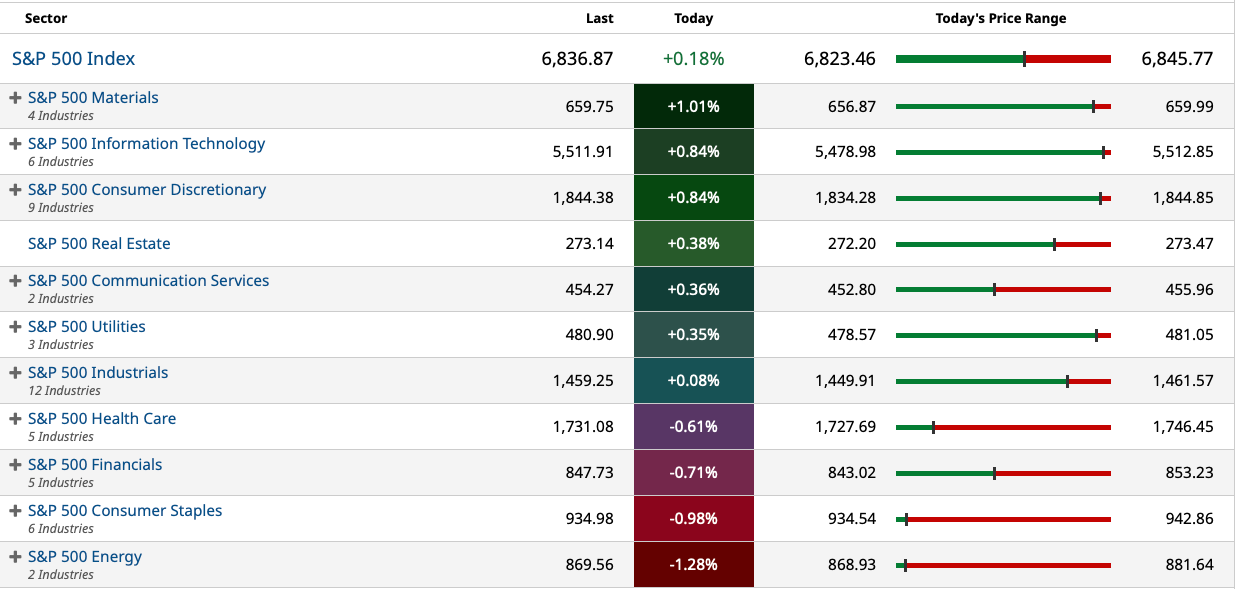
S&P Sectors
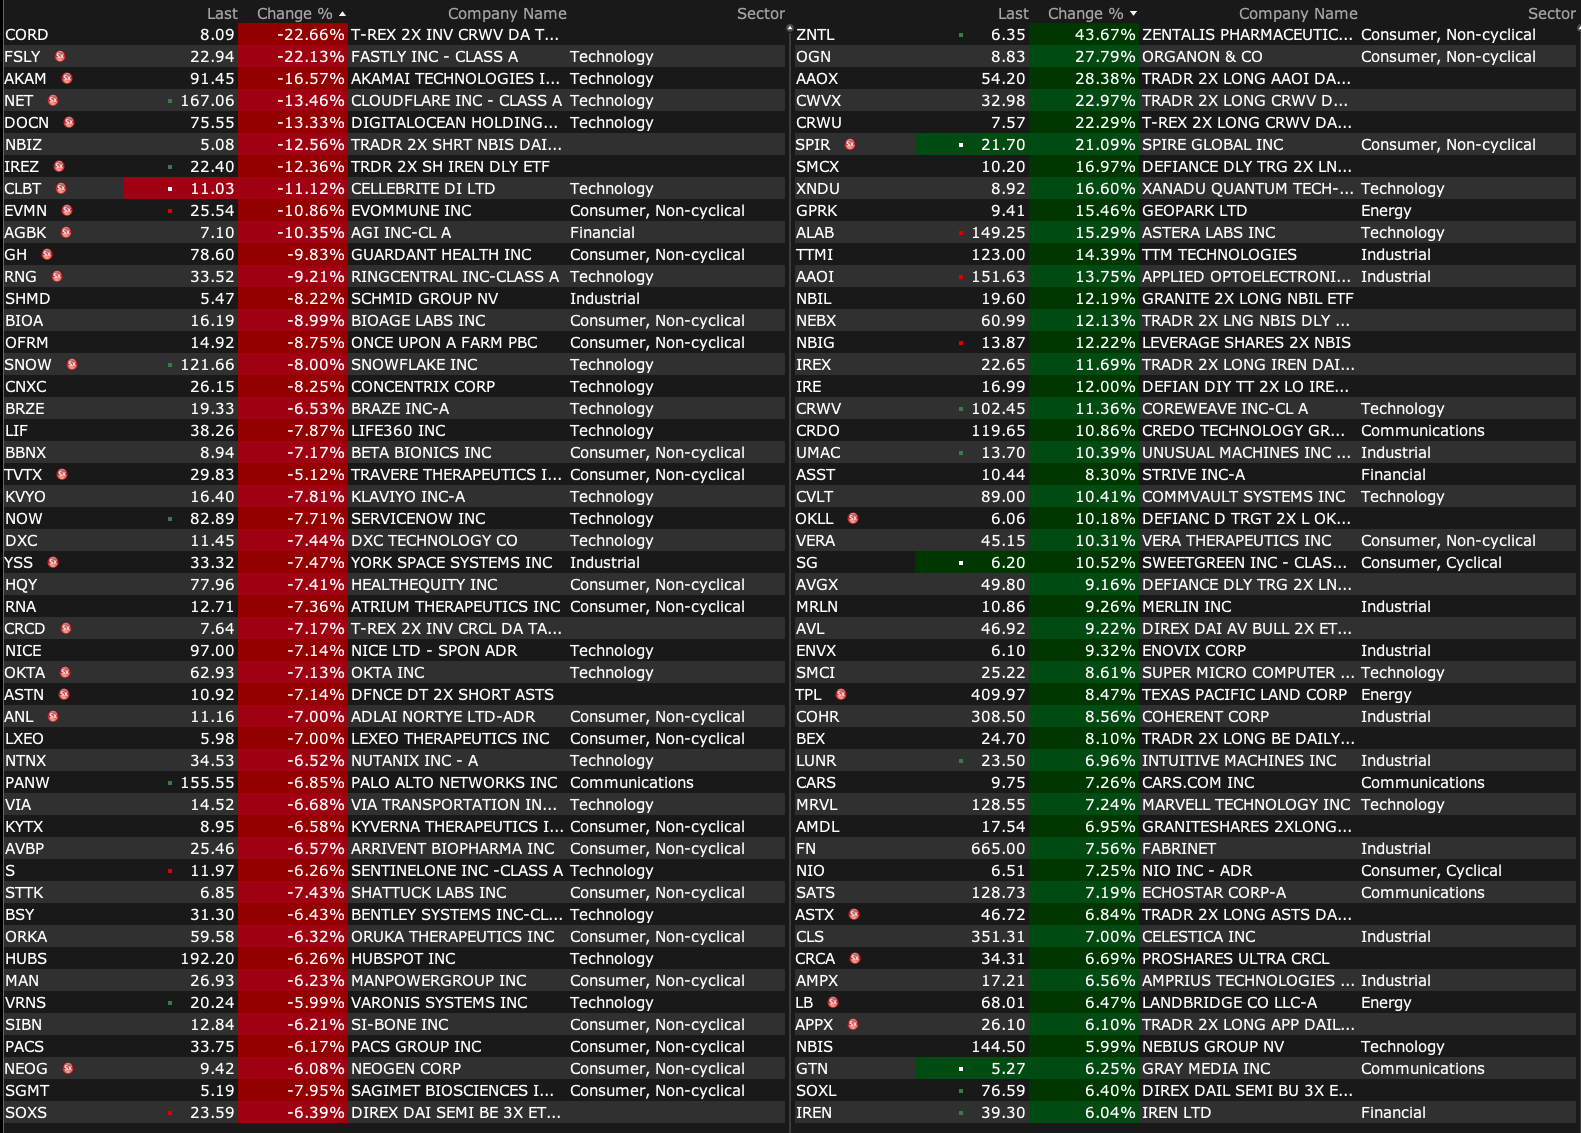
% Movers
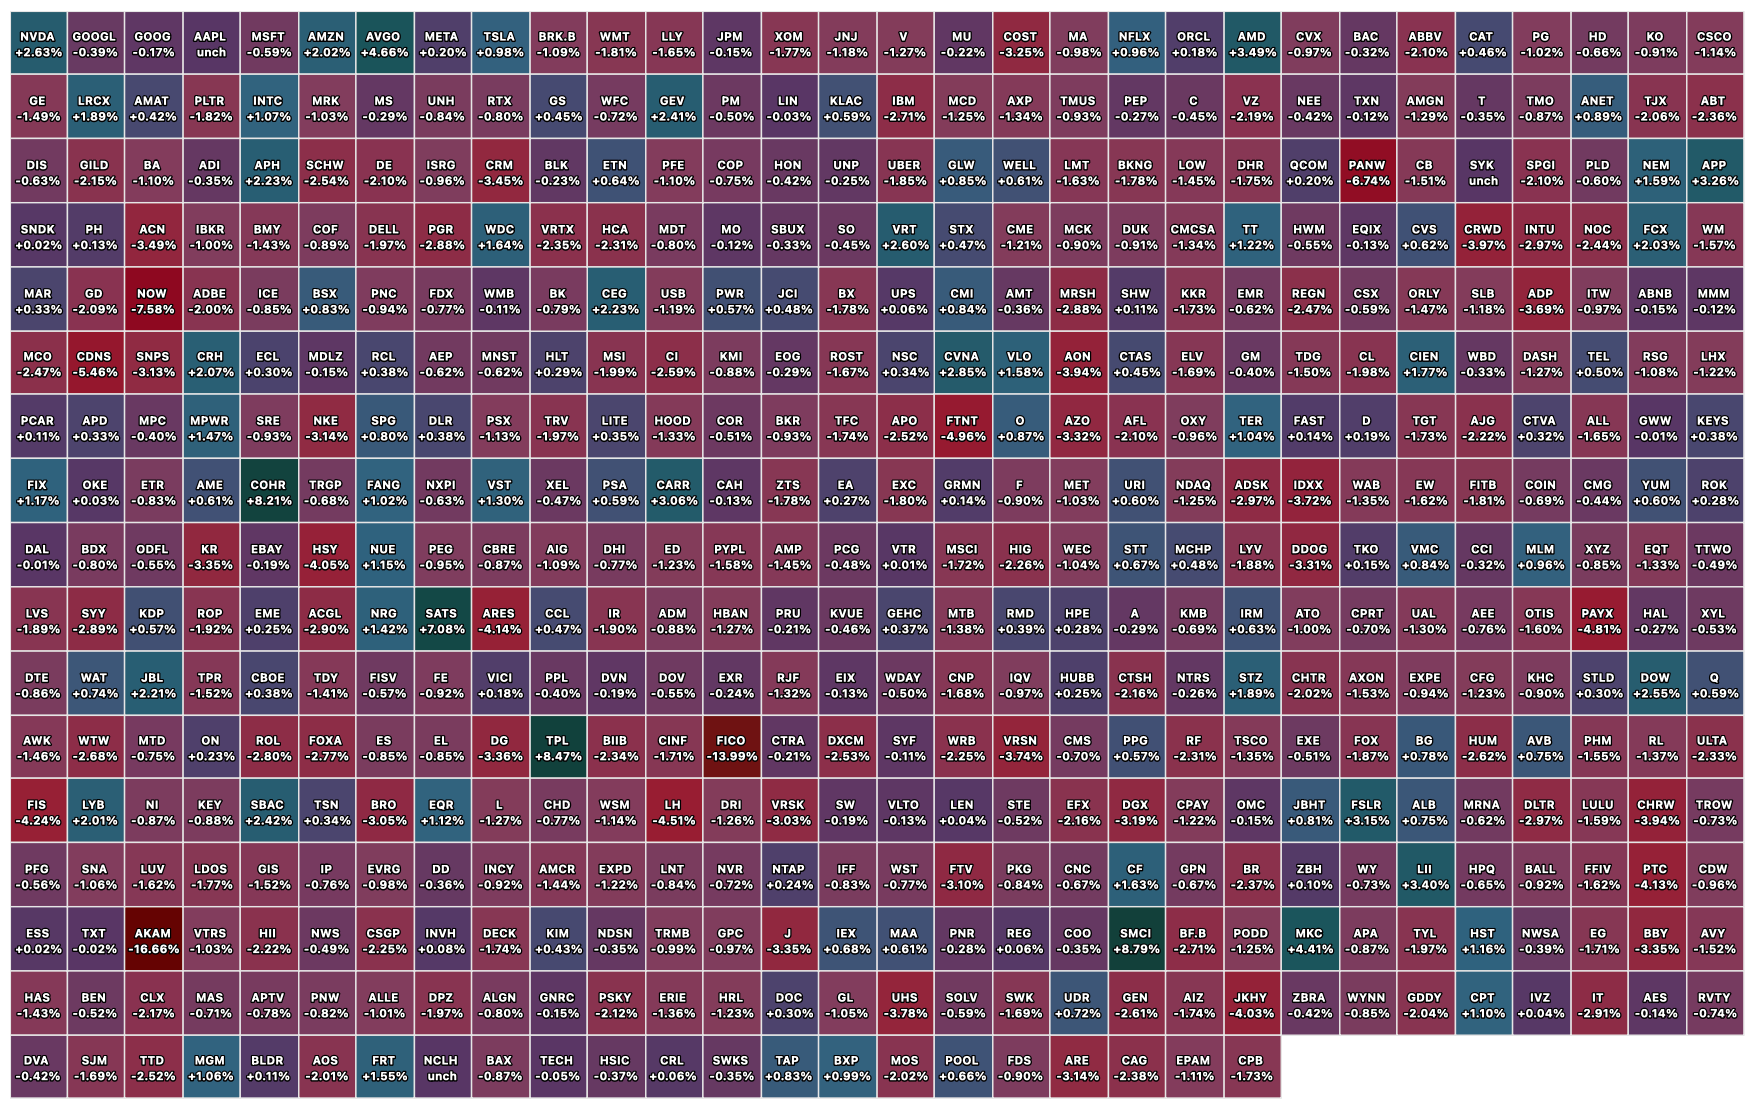
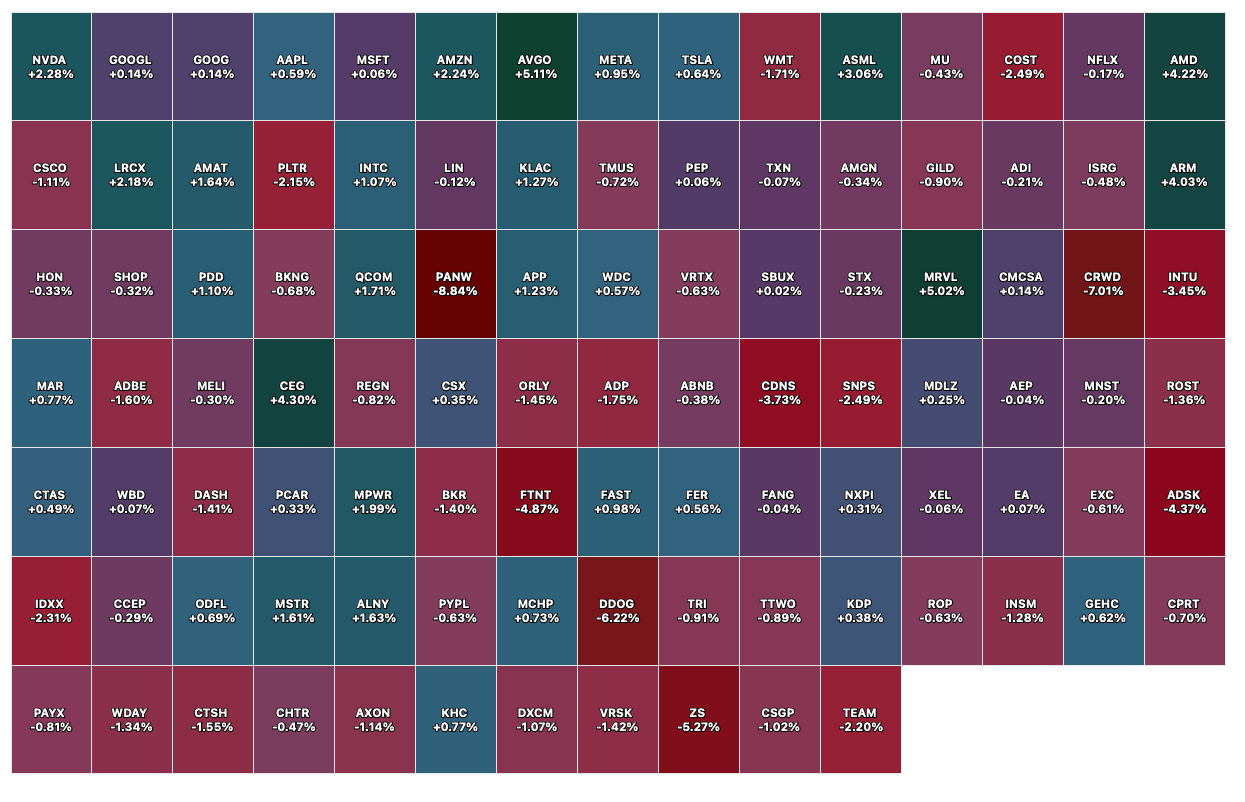
Nasdaq 100 Heat Map
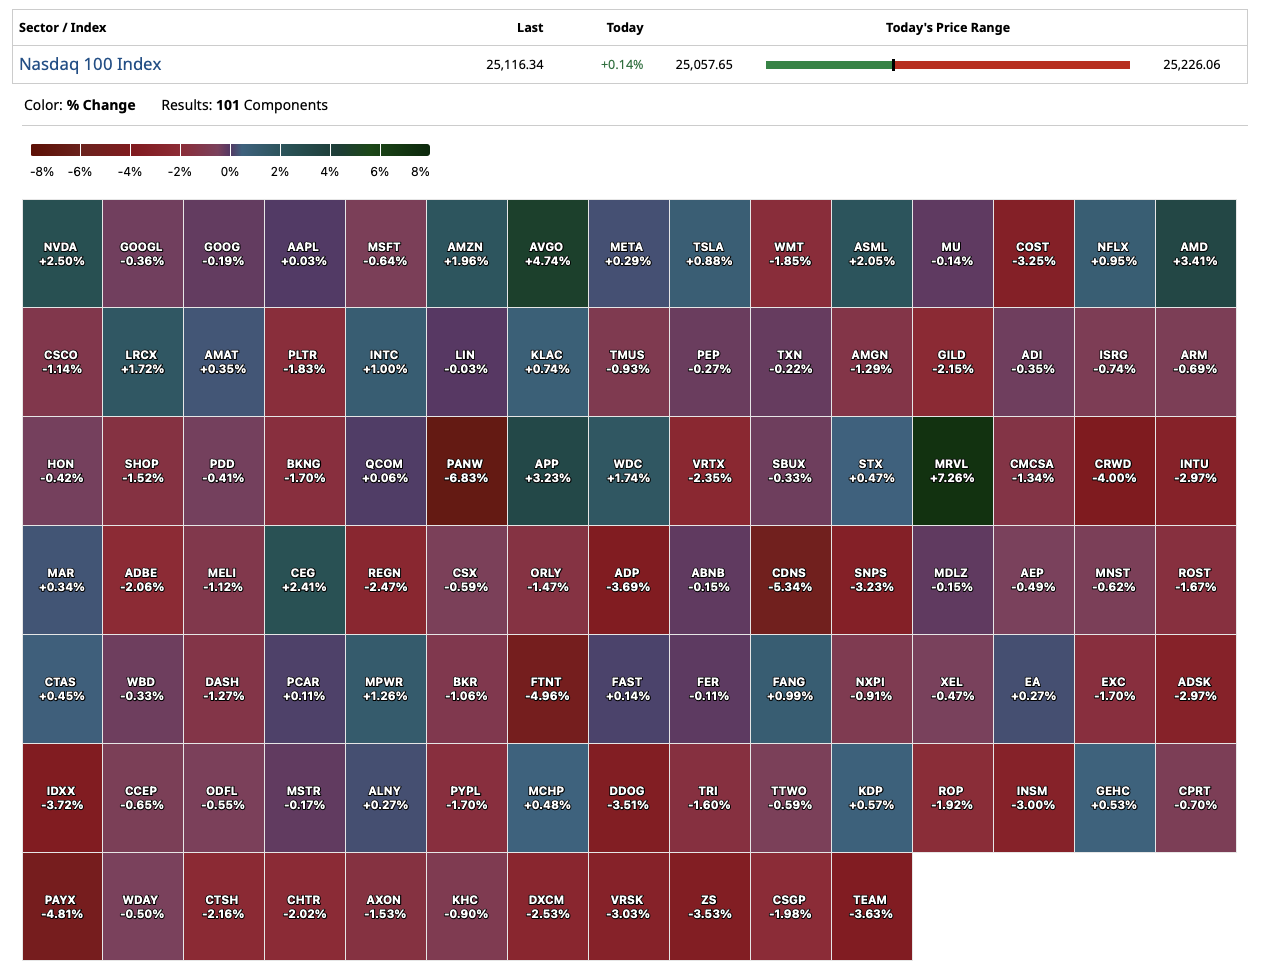
Closing S&P 500 Heat Map
BY Doug Kass · Apr 10, 2026, 4:44 PM EDT
A sincere thank you for reading my Diary today and all week.
I hope I added value.
Enjoy the weekend.
Be safe.
BY Doug Kass · Apr 10, 2026, 4:00 PM EDT
BY Doug Kass · Apr 10, 2026, 3:45 PM EDT
BY Doug Kass · Apr 10, 2026, 2:55 PM EDT
Wolf Street howls about the expected waves of energy-related inflation ahead.
BY Doug Kass · Apr 10, 2026, 2:47 PM EDT
* The President is now recommending stocks!
The tweet below is not from The Borowitz Report The Borowitz Report | Substack.
It is not from The Onion. Home - The Onion
And it is not from Mad Magazine. MAD Magazine | Welcome to MAD
It is real.
It is surreal.

BY Doug Kass · Apr 10, 2026, 2:20 PM EDT
From Peter Boockvar:
Positives,
1) Two week ceasefire, however fragile.
2) Delayed by a week in its reporting, continuing claims fell below 1.8mm to 1.794mm, the lowest since May 2024 from 1.832mm. The big question here is whether people are finding new jobs or benefits are expiring?
3) Purchase applications bounced a touch, by 1.1% w/o/w after falling in the two prior weeks with the rise in mortgage rates.
4) From Delta: “Demand was broad based across corporate and leisure, with continued momentum in high margin, diverse revenue streams…Looking at the current environment, demand remains strong. The acceleration we saw in March is carrying forward into the June quarter. Over the last month, cash sales, which are the clearest indicator of demand, are up double digits, with strength across the booking curve, geographies, and products. Our consumers are continuing to prioritize experiences, with travel among the top spending categories.”
5) Taiwan Semi reported Q1 sales growth that exceeded expectations rising 35% with a 45% increase particularly in March. One has to wonder though whether the March spike was a rush in ordering with the war and the helium supply issues that are now a big challenge.
6) From Levi Strauss: “We saw the growth broad based across segments, channels, genders and categories…We are very cognizant of the environment around us, but our consumer is responding to innovation, newness, and Levi’s is a great value.”
7) Coincident with this was the March Taiwan export spike of 62%, almost double the estimate of up 35%. Exports to the US in particular skyrocketed by 124% y/o/y.
8) The BoK, RZND and RBI all leave rates unchanged as they sit and watch.
Negatives,
1) Strait is still effectively closed even though it seems there has been a slight pick up in shipping moving through it.
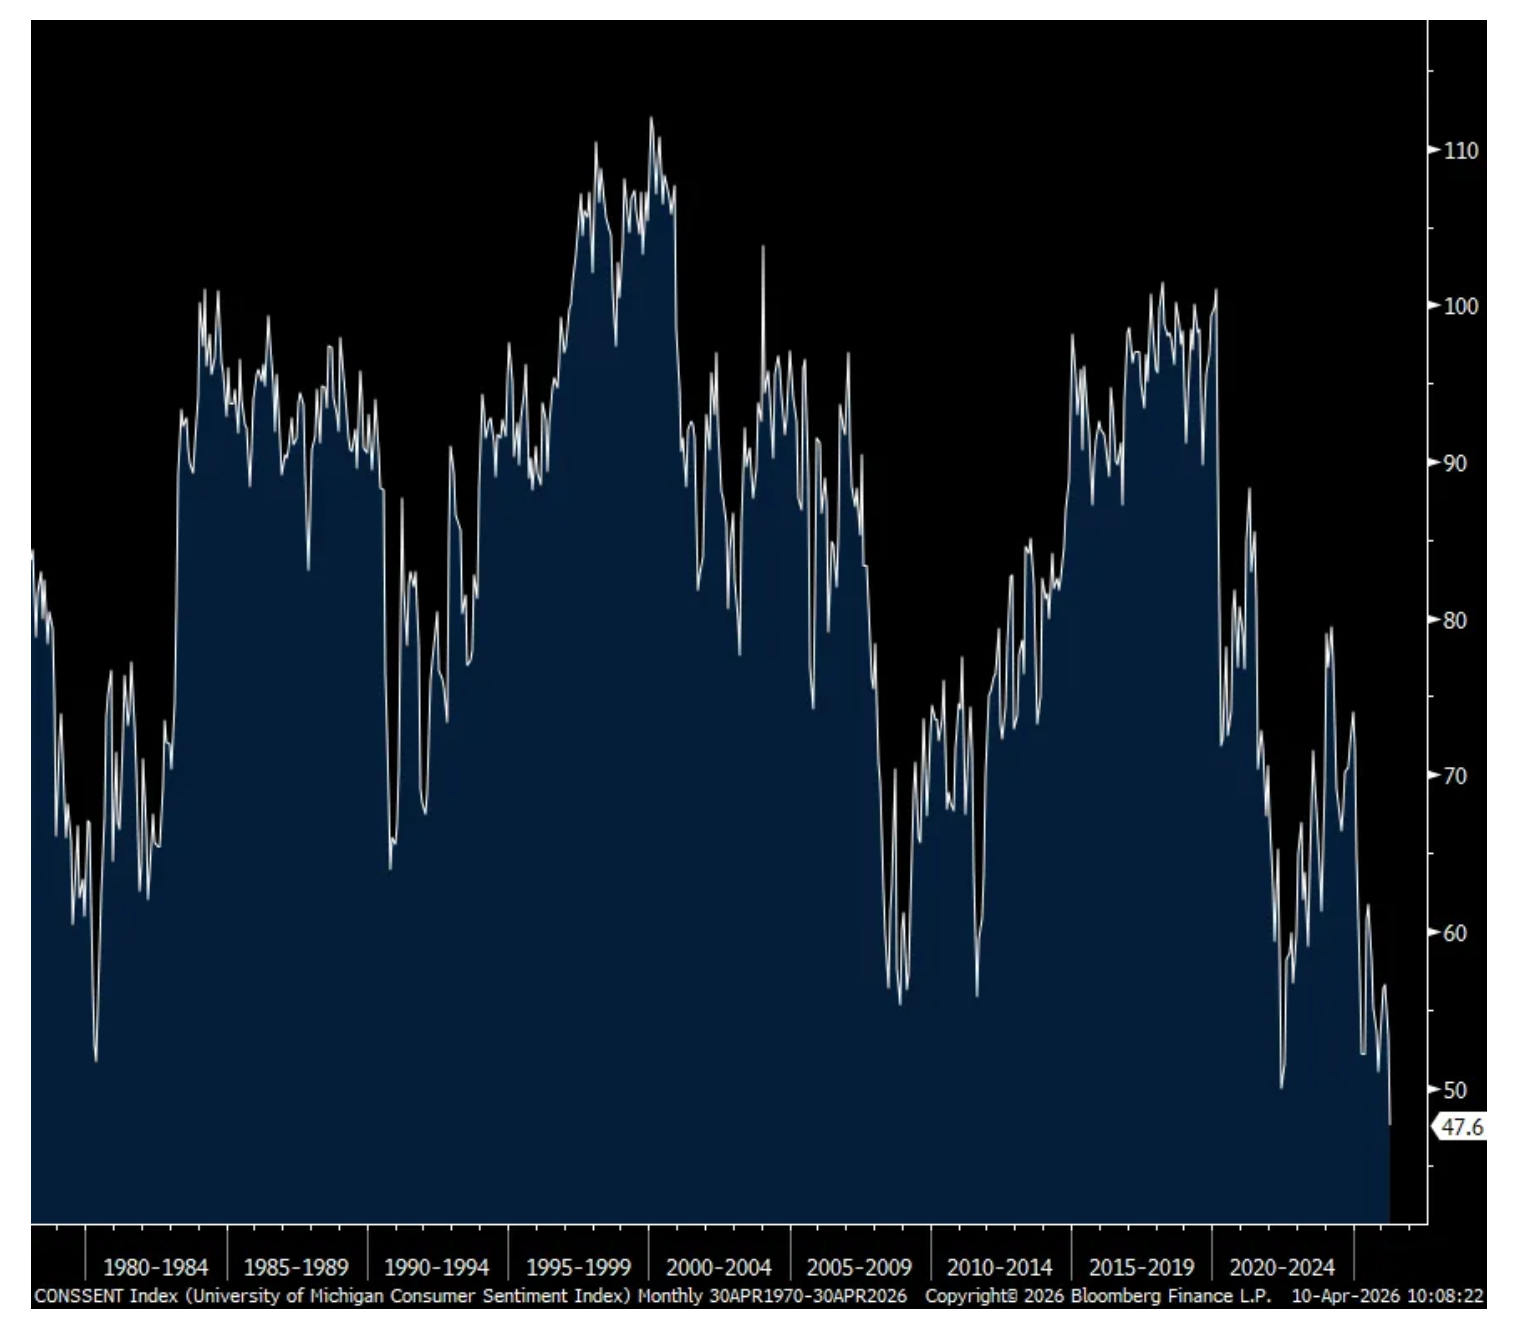
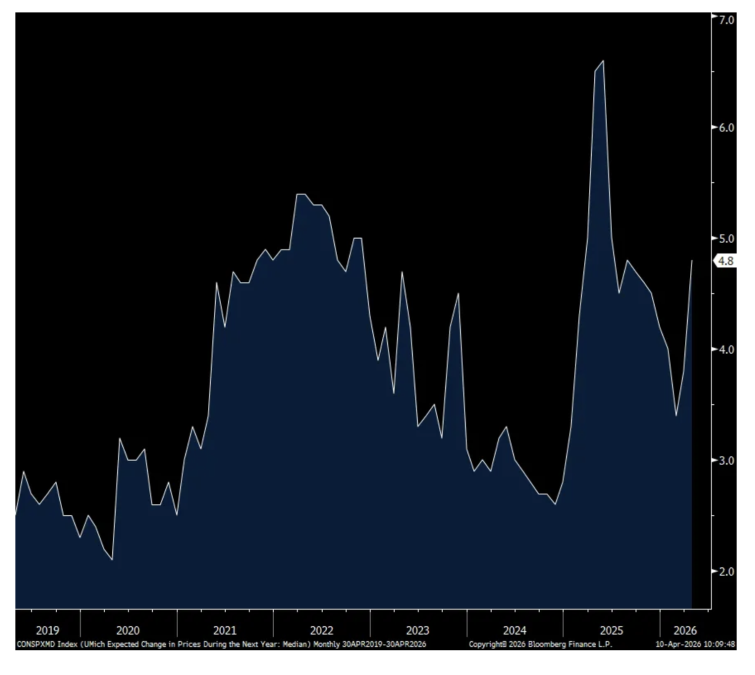
2) The April UoM consumer confidence fell to just 47.6 and a record low dating back to the 1970’s. That’s down from the 53.3 seen in March and the pre war print of 56.6. Both the Current Conditions and Expectations components were lower m/o/m. The one year inflation expectation jumped to 4.8% from 3.8% and the 5-10 yr guess was 3.4%, up from 3.2% in March. Of course, higher gasoline prices are the main factor as this component went to 70 from 34 pre war. The employment component deteriorated to 41 from 52 and that is just 1 pt from matching the lowest since 2008. The income index remained below zero at -4 vs -3 in the month before. Spending intentions for big ticket items fell across the board. The UoM said, “Demographic groups across age, income, and political party all posted setbacks in sentiment, as did every component of the index, reflecting the widespread nature of this month’s fall.” Of note too, “Assessments of personal finances declined about 11%, with consumers expressing a substantial increase in concerns over high prices and weaker asset values…About 54% of consumers spontaneously mentioned that high prices were eroding their personal finances, up from 47% last month and 38% a year ago.”
3) March headline CPI rose by .9% m/o/m as expected while the core rate was up a much more modest .2% vs the forecast of .3%. The y/o/y gain got boosted to 3.3% from 2.4% while the core rate is higher by 2.6% vs 2.5% in February. As expected, energy prices jumped by 10.9% m/o/m and by 12.5% y/o/y with gasoline in particular up by 21% m/o/m and 19% y/o/y. Food prices were flat vs the .4% rise in the month before but it’s only a matter of time before food prices rise more notably. Food prices at home were down by .2% m/o/m but up 1.9% y/o/y. Eating out saw a price increase of .2% m/o/m and 3.8% y/o/y. Overall services prices ex energy saw prices up .2% m/o/m and 3% y/o/y. On the goods side, core prices rose .1% m/o/m and 1.2% y/o/y.
4) Initial jobless claims rose to 219k from 203k and that was 9k above the estimate. The 4 week average increased by 1.5k w/o/w to 210k.
5) The March ISM services index fell to 54 from 56.1 and below the estimate of 54.9. The Business Activity component dropped by 6 pts to 53.9, the lowest since September. Higher energy prices, along with others, took the Prices Paid line item to 70.7 from 63 and that matches the highest since August 2022. With regards to industry breadth, 13 saw growth vs 14 in February while 3 said their business contracted, the same number seen last month with the balance seeing no change. Not surprisingly the ISM said this, “The predominant commentary this month was about impacts and adjustments due to the conflict with Iran and the expected flow through of higher oil prices at some point. Companies across many industries reported seeing higher gas and diesel pricing, and inventories of multiple goods increased to withstand supply chain disruptions or short-term oil price impacts. Such construction products as lumber, copper and steel were noted as up in price. Although tariff impacts were still noted by panelists, Iran-related impacts dominated the comments in March.”
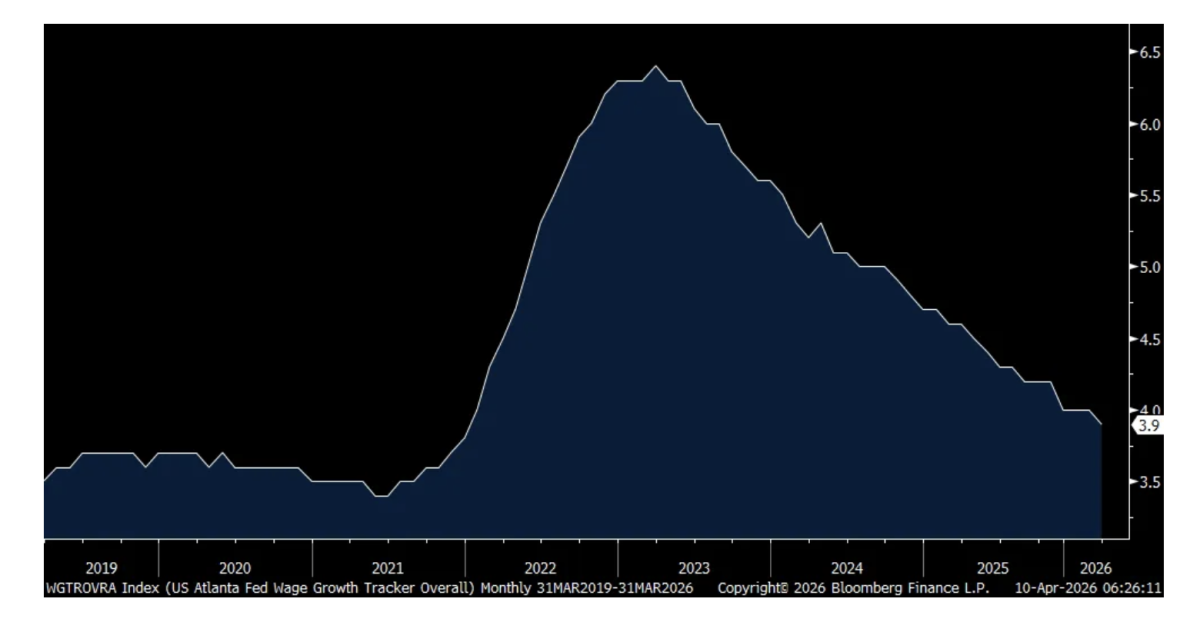
6) The Atlanta Fed’s Wage Growth Tracker for March rose 3.9% y/o/y, still pretty good relative to pre Covid but that’s the most modest pace since late 2021. Under the hood though is more helpful to get better color as wage growth accelerated for a ‘job switcher’ to 5% y/o/y, the best since June 2024. And for ‘job stayers’, wage growth was 3.8%, up .2% from February, though well off its highs. This means that wage growth for new entrants is where the slowing is taking place and likely in response to the slowdown in hiring.
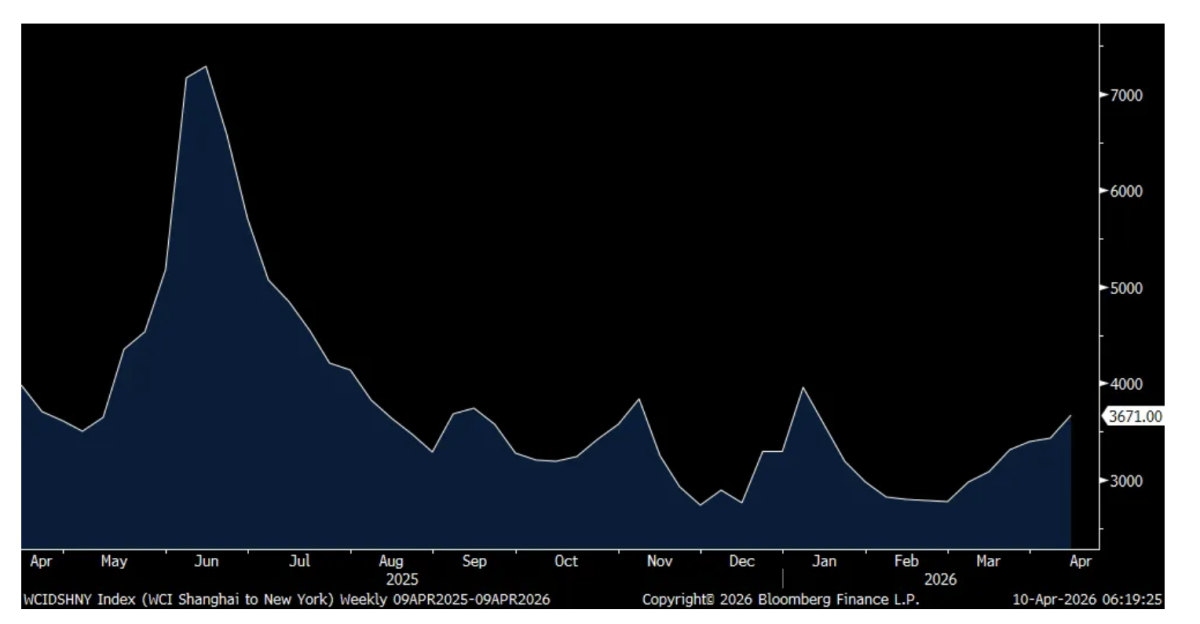
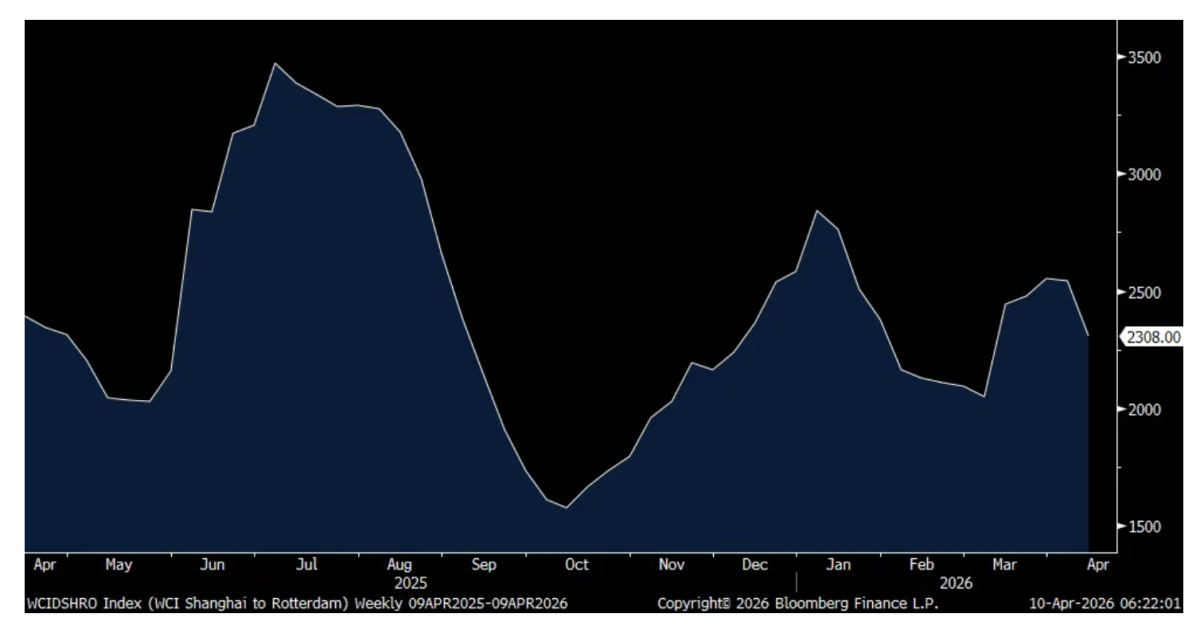
7) The Shanghai to LA journey for a 40 foot container now costs $2,910, up 9% w/o/w and that is the highest since early January. The Shanghai to NY trip was up $237 w/o/w to $3,671. The Shanghai to Rotterdam route is where prices have been more tame as they fell 9% w/o/w though off its October lows.
8) From the Logistics Managers’ Index: “Transportation prices skyrocketed (+12.7) in March to 89.4, which is the highest level since March 2022” when it got to 89.7. And, “With the current leanness of inventories, firms will not have large stores of goods and components to draw on, which may necessitate some continued movement in freight. The leanness extends to fleet sizes as well, which have right sized considerably since 2022, meaning there will be less excess capacity this time around.”
9) Manheim said that its March wholesale used vehicle index rose 6.2% y/o/y and 1.4% m/o/m. They said “As soon as this year began, prices at Manheim started moving higher as dealers anticipated strong demand from higher tax refunds to consumers. Sales conversion rates, a clear sign of demand, were higher against 2025 for every week but one in Q1, and vehicle value trends at auction show we are well ahead of last year and where we would normally be during a spring bounce in the wholesale markets.” And this, “We thought we’d see some impact from the Middle East conflict, and that may still happen. But right now, the data is clear: used vehicle demand is healthy and inventory levels are relatively tight.”
10) Refi’s declined for a 4th straight week.
11) In terms of bringing more oil supply on the market, the US crude oil rig count continues to bounce along the lowest level since September 2021.
12) When including the downward revision to January, the February durable goods orders figure at the core level were below expectations.
13) From WD-40: “Subsequent to our quarter end, recent geopolitical developments in the Middle East have contributed to the increased costs of certain petroleum based specialty chemicals and other input costs, which will impact our cost of products sold. There is typically a delay of between 90 and 120 days before changes in cost of raw materials impact our cost of products sold, due to production and inventory lifecycles.”
14) From Constellation Brands: “U.S. consumers, particularly those within lower-income households, continued to face financial pressures from the cumulative effects of inflation, along with ongoing broader economic uncertainty and additional headwinds from other socioeconomic factors. As a result, spending behavior across beverage alcohol categories became more deliberate, with consumers increasingly seeking value and exhibiting greater selectivity in their purchases. Despite these pressures, consumers remained engaged with the category, often trading within portfolios and seeking value through pack sizes and price points rather than exiting the category altogether. Overall demand across beer, wine, and spirits however remained subdued during much of the year.”
15) From Delta: In response to the jet fuel price spike, “we are meaningfully reducing capacity in the current quarter, with a downward bias until we see the fuel situation improve. At the same time, we’re moving quickly to recapture higher fuel prices.”
16) From Kura Sushi: Comps grew 8.6%, “with 4.3% of positive traffic, and 4.3% of price on the mix.” Out of home food price inflation is still real.
17) The final March Eurozone services PMI was left little changed at 50.2 vs 50.1 in the initial print and down from 51.9 in February. S&P Global said “At the national level, economic activity trends were mixed. Spain was the fastest growing country in March, registering an accelerated upturn. Ireland followed closely behind, despite the rate of expansion easing to a six month low. The Eurozone’s largest economy - Germany - continued to see activity growth at the end of the first quarter, albeit with its rate of increase slowing to the weakest in the year to date. Meanwhile, France and Italy recorded contractions.” Some more, “The encouraging signs of growth seen earlier in the year have been eradicated thanks to surging energy prices, choked supply chains, financial market volatility and a renewed downturn in demand. The accompanying surge in prices raises the unwelcome spectre of stagflation, or worse, in the near term.”
18) The final UK services PMI for March was 50.5 vs 53.9 in February. S&P Global said “UK service providers experienced a marked slowdown in output growth in March as the war in the Middle East encouraged greater risk aversion among clients and postponed investment decisions.”
19) The March Singapore PMI fell to 56.7 from 59.2. Hong Kong’s PMI dropped below 50 at 49.3 from 53.3.
BY Doug Kass · Apr 10, 2026, 1:50 PM EDT
From Keith McCullough at Hedgeye:
Attention Homegamers... @KeithMcCullough analysis or the $VIX risk range (yesterday and today) was worth the price of @hedgeye admission.
— Dougie Kass (@DougKass)
Look what happened to equities at about 10:30 AM when the VIX, at first broke support at 19.05- 19.10 (it went to 18.83) but then quickly… https://t.co/udfREvhEAD
BY Doug Kass · Apr 10, 2026, 1:05 PM EDT
BY Doug Kass · Apr 10, 2026, 12:52 PM EDT
Here are today's things:
* Added to index shorts:
(SPY) $681.21
(QQQ) $612.32
* Shorted more (GRNY) at $25.09
* Added to VRNO (cannabis) long at $1.16
Position: Long VRNO (S); Short SPY common (VS), QQQ common (VS), GRNY (S)
BY Doug Kass · Apr 10, 2026, 12:05 PM EDT
From Peter Boockvar:
The April UoM consumer confidence fell to just 47.6 and a record low dating back to the 1970’s. That’s down from the 53.3 seen in March and the pre war print of 56.6. Both the Current Conditions and Expectations components were lower m/o/m. The one year inflation expectation jumped to 4.8% from 3.8% and the 5-10 yr guess was 3.4%, up from 3.2% in March. Of course, higher gasoline prices are the main factor as this component went to 70 from 34 pre war.
The employment component deteriorated to 41 from 52 and that is just 1 pt from matching the lowest since 2008. The income index remained below zero at -4 vs -3 in the month before. But, the UoM said, “Overall, in contrast to views of business conditions and inflation, consumer views of labor markets do not appear to have further degraded following the start of the Iran conflict.”
Spending intentions for big ticket items fell across the board.
No segment of the consumer was left unscathed with how they felt based on what’s going on in the world. The UoM said, “Demographic groups across age, income, and political party all posted setbacks in sentiment, as did every component of the index, reflecting the widespread nature of this month’s fall.”
Of note too, “Assessments of personal finances declined about 11%, with consumers expressing a substantial increase in concerns over high prices and weaker asset values…About 54% of consumers spontaneously mentioned that high prices were eroding their personal finances, up from 47% last month and 38% a year ago.”
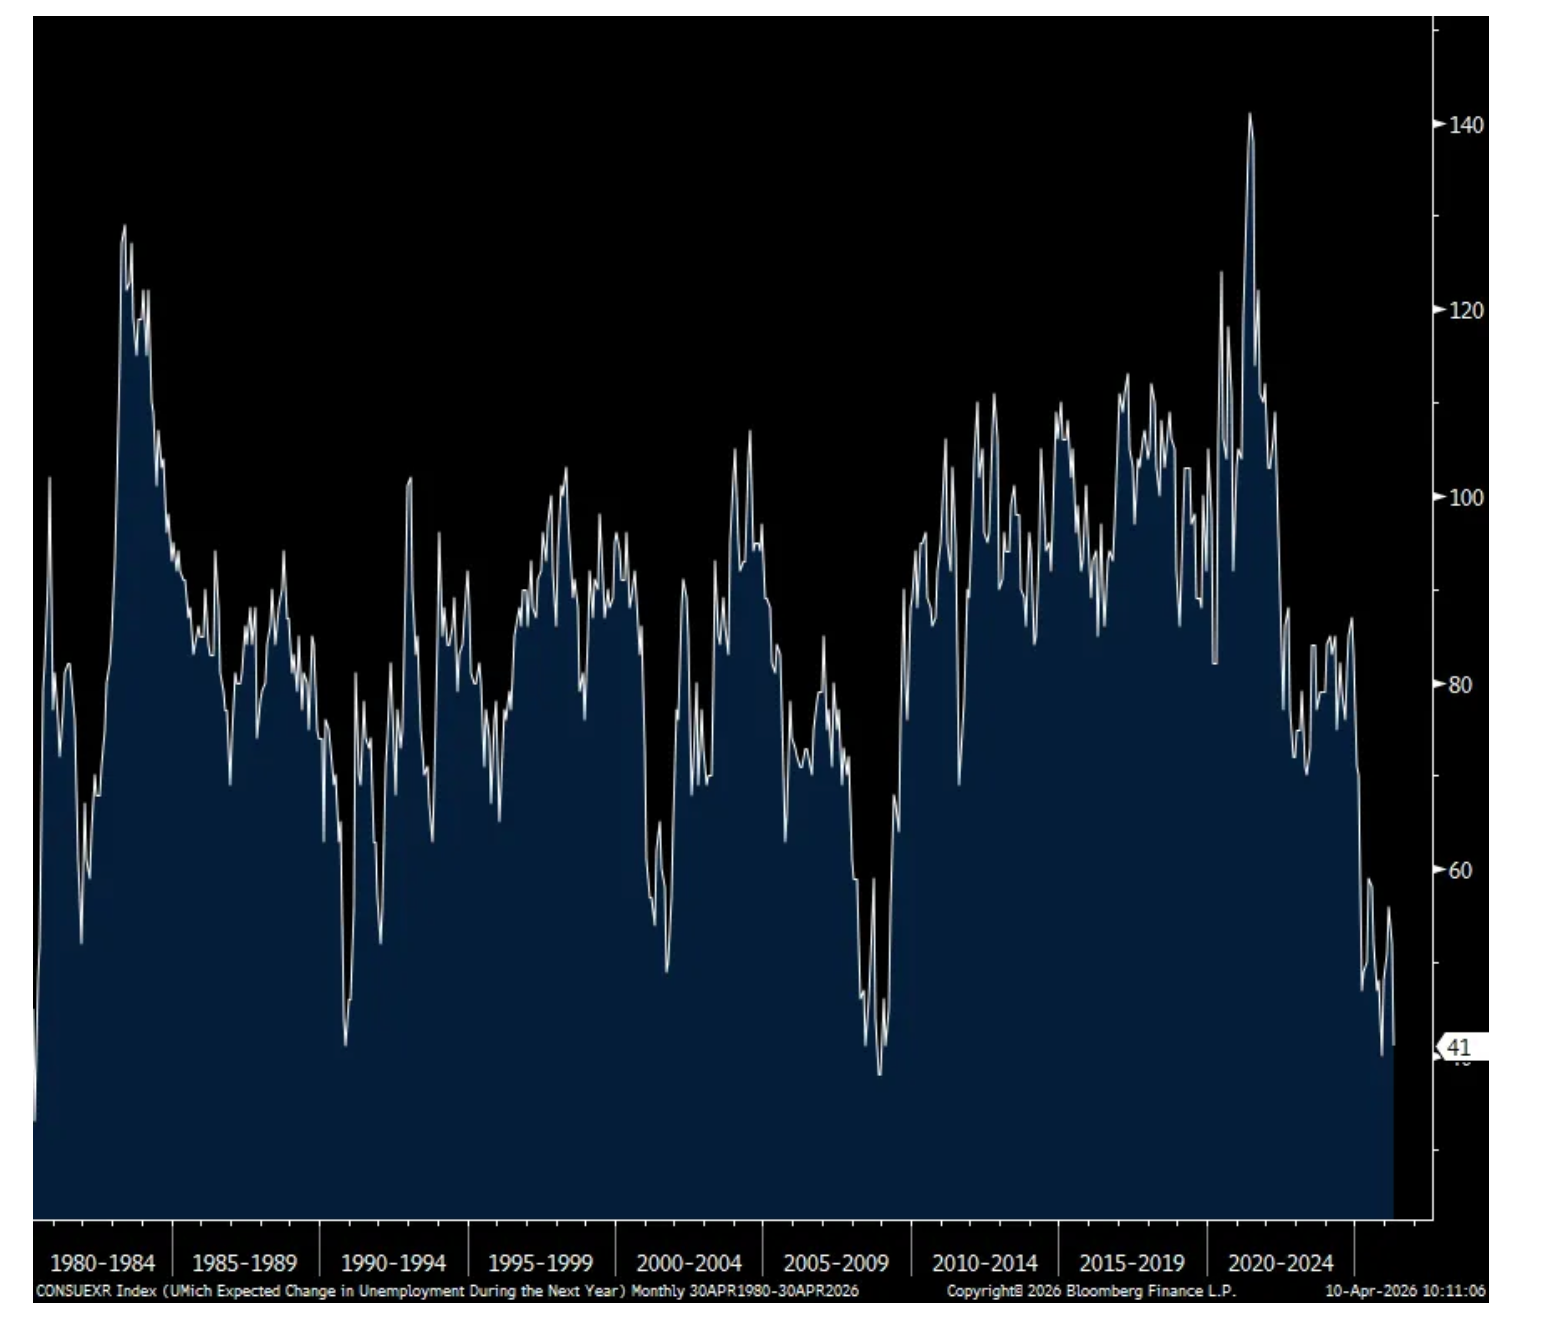
Bottom line, we know an index such as this is more touchy, feely in terms of sentiment and doesn’t necessarily equate to how people act. That said, a record low index read dating back to the data I have to 1978 is certainly very noteworthy.
UoM
One yr Inflation Expectations
Employment
None.
BY Doug Kass · Apr 10, 2026, 11:55 AM EDT
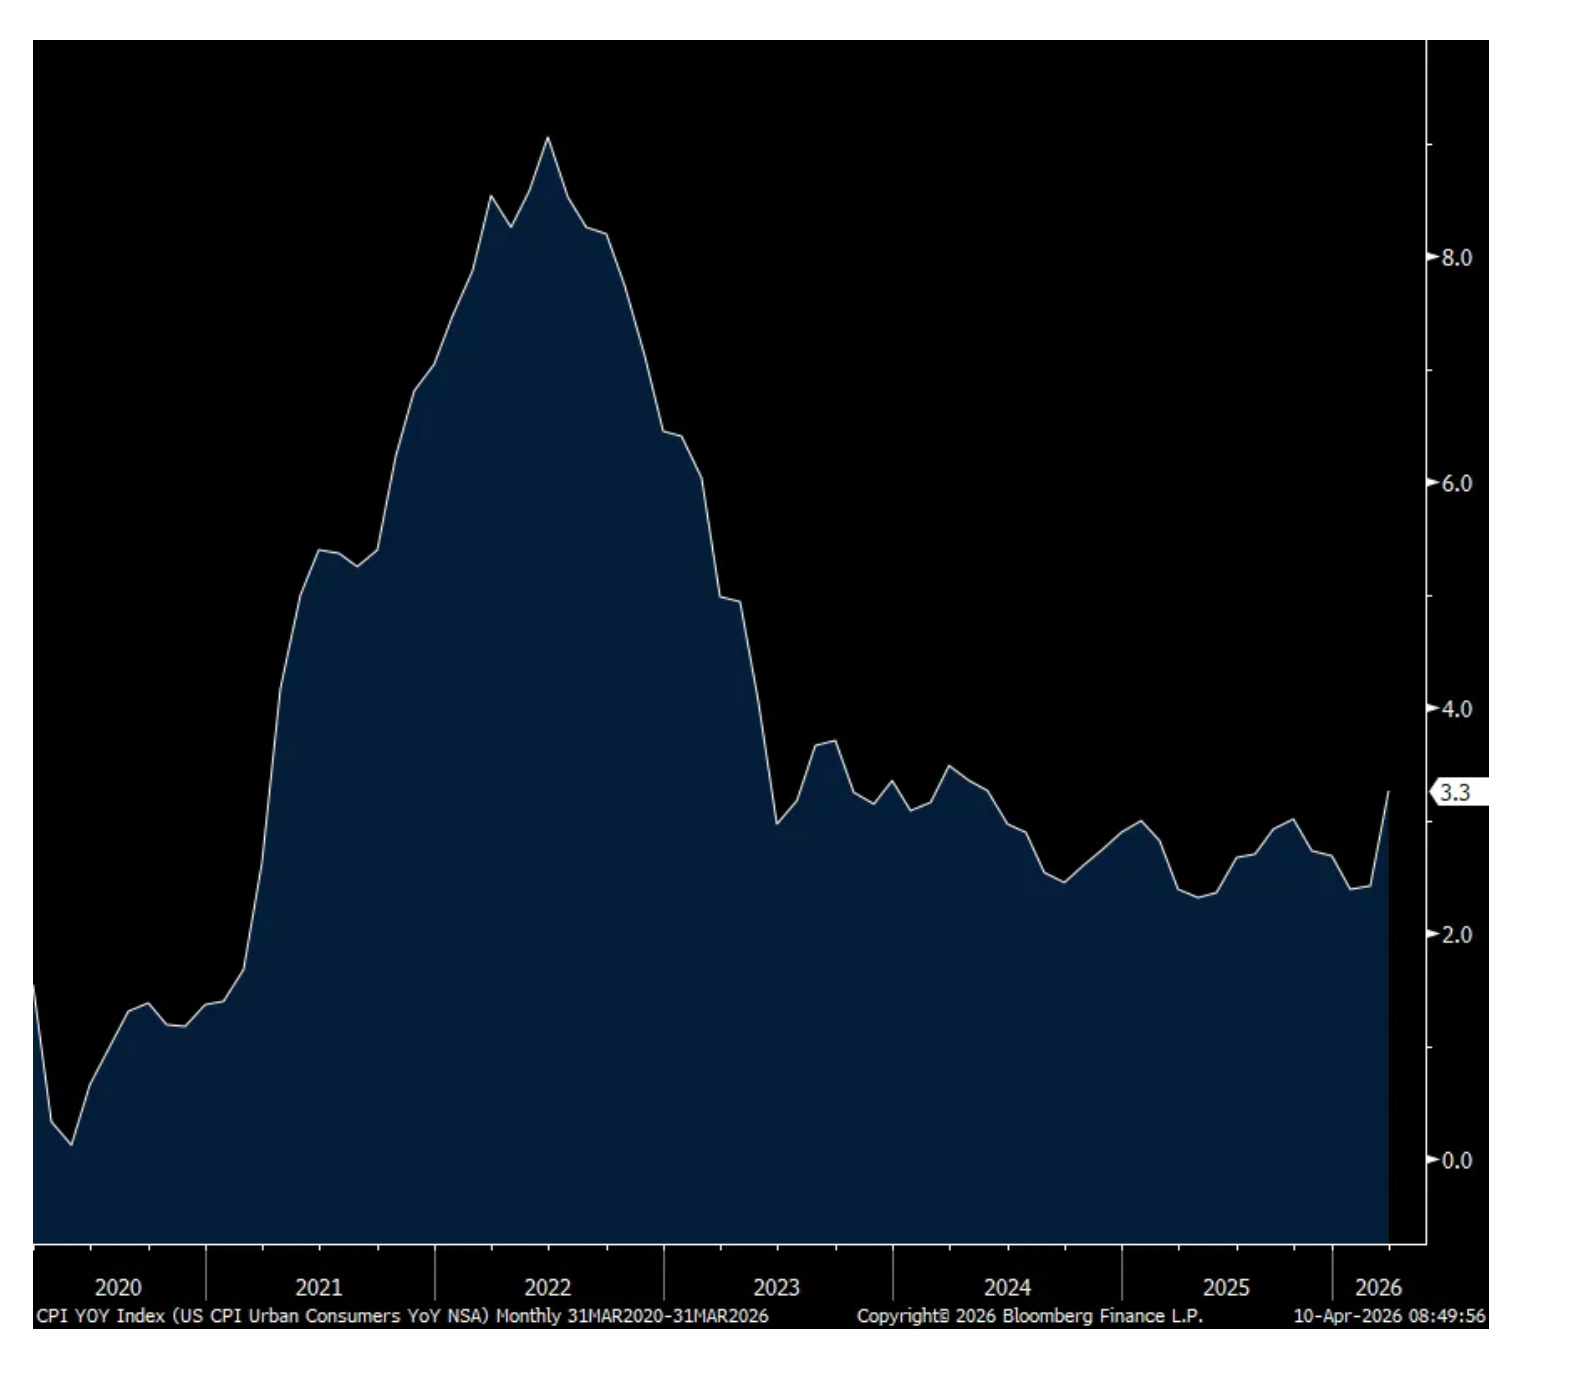
From Peter Boockvar:
March headline CPI rose by .9% m/o/m as expected while the core rate was up a much more modest .2% vs the forecast of .3%. The y/o/y gain got boosted to 3.3% from 2.4% while the core rate is higher by 2.6% vs 2.5% in February. As expected, energy prices jumped by 10.9% m/o/m and by 12.5% y/o/y with gasoline in particular up by 21% m/o/m and 19% y/o/y. Food prices were flat vs the .4% rise in the month before but it’s only a matter of time before food prices rise more notably. Food prices at home were down by .2% m/o/m but up 1.9% y/o/y. Eating out saw a price increase of .2% m/o/m and 3.8% y/o/y.
Keeping a lid on the core rate was the .2% m/o/m drop in medical care costs, though still up 3.1% y/o/y. Not in touch with any reality that I’m aware of, the BLS said health insurance prices fell 1.4% m/o/m and by 5.3% y/o/y. OER was up .3% m/o/m and 3.1% y/o/y. Rent of Primary Residence prices rose .2% m/o/m and by 2.6% y/o/y and continues to decelerate and should further in the coming quarters. Overall services prices ex energy saw prices up .2% m/o/m and 3% y/o/y. As we heard from Delta the other day talking about capacity cuts, in addition to having to absorb the spike in jet fuel, airfare prices were up 2.7% in the month alone after big increases in the prior months and higher by 15% y/o/y. Vehicle maintenance costs were up a robust 1.3% in the month and by 6.1% y/o/y. Vehicle insurance prices continued to slow, in part due to tough comps. They were up just .8% y/o/y.
On the goods side, core prices rose .1% m/o/m and 1.2% y/o/y as used car prices fell again, by .4% m/o/m and 3.2% y/o/y. If Manheim’s wholesale used car index is any gauge though, which it is, prices should be heading higher in the coming months. New car prices were little changed, up .1% m/o/m and .5% y/o/y. Apparel prices have really picked up for a 2nd month, up 1% m/o/m and by 3.4% y/o/y with tariffs I’m sure a factor. The prices of household furnishings and supplies fell .2% m/o/m after a string of increases and up by 3.6% y/o/y.
Bottom line, a not unexpectedly hot headline but more tame core. That said, we have to understand that it will take months for the higher energy prices, along with plastics, packaging, etc… to flow into the core rate.
I will include here again what WD-40 said last night, “Subsequent to our quarter end, recent geopolitical developments in the Middle East have contributed to the increased costs of certain petroleum based specialty chemicals and other input costs, which will impact our cost of products sold. There is typically a delay of between 90 and 120 days before changes in cost of raw materials impact our cost of products sold, due to production and inventory lifecycles.” Which means that it will be many months for the current price spike of a variety of things, if sustained of course, to work its way through the supply chains and companies respond on how to offset it, with I’m sure many trying to test the elasticity of price increases.
Headline CPI y/o/y
None.
BY Doug Kass · Apr 10, 2026, 11:35 AM EDT
The one observation I would make today is that — given the plethora of adverse outcomes — Mr. Market is back in a forgiving mood.
Rising interest rates, sticky inflation, credit quality issues (private equity stocks are making a new low), policy issues, geopolitical risks, a massive deficit and growing U.S. debtload, an equity risk discount and still elevated valuations are being dismissed by ever-optimistic market participants (men, women and machines).
BY Doug Kass · Apr 10, 2026, 11:25 AM EDT
Long FNMA vs. FMCC vs
BY Doug Kass · Apr 10, 2026, 11:15 AM EDT
- NYSE volume 20% below its one-month average;
- Nasdaq volume 9% above its one-month average;
- VIX index: down 2.82% to 18.94
None.
BY Doug Kass · Apr 10, 2026, 10:50 AM EDT
From 9:58 a.m. ET.
None.
BY Doug Kass · Apr 10, 2026, 10:12 AM EDT
Though I remain very small I added to my Index shorts:
* (SPY) $681.29
* (QQQ) $612.13
Short SPY common VS QQQ common VS
BY Doug Kass · Apr 10, 2026, 9:53 AM EDT
From Peter Boockvar:
An update on container shipping prices according to the World Container Index. The Shanghai to LA journey for a 40 foot container now costs $2,910, up 9% w/o/w and that is the highest since early January. The Shanghai to NY trip was up $237 w/o/w to $3,671. The Shanghai to Rotterdam route is where prices have been more tame as they fell 9% w/o/w though off its October lows. Bottom line, not only do we watch to see if there are any lingering issues around shipping near the Red Sea but to also the influence of higher heavy fuel oil prices that typically powers these ships.
Shanghai to LA
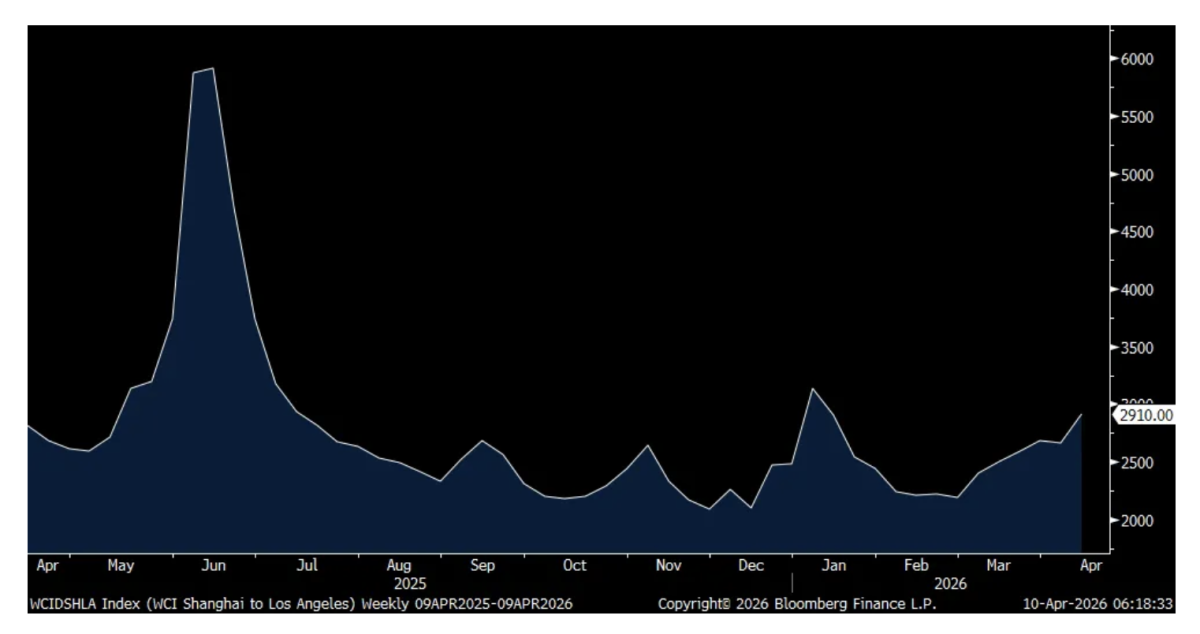
Shanghai to NY
Shanghai to Rotterdam
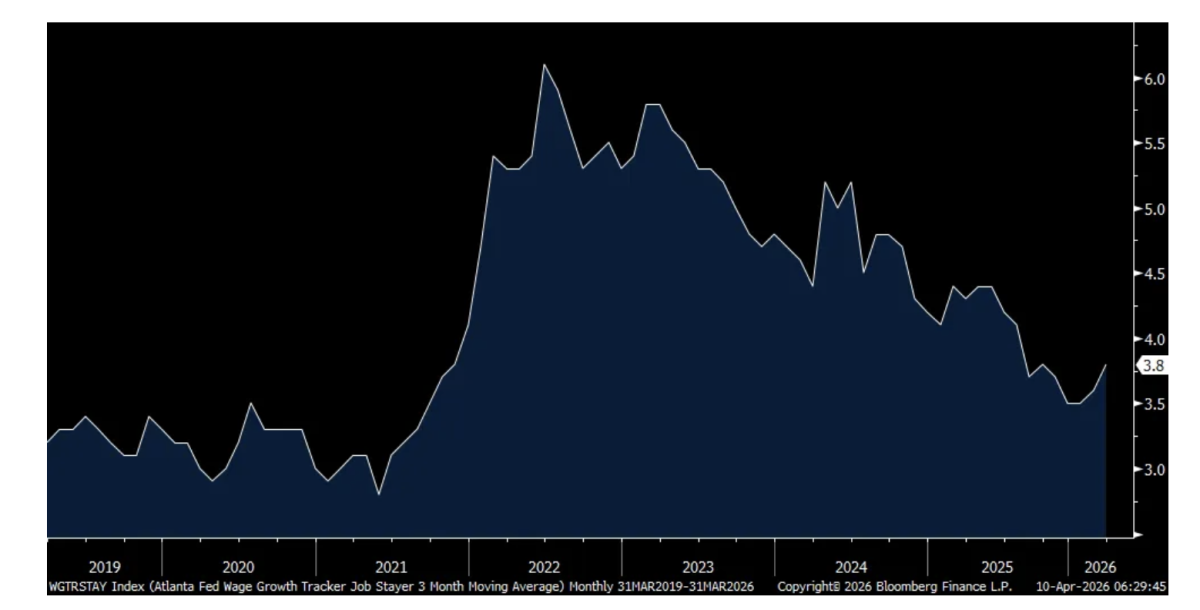
With the cost of living still a problem, and more so for those buying gasoline and most anything else, the rate of change with wage growth continues to slow according to the Atlanta Fed. Their Wage Growth Tracker for March rose 3.9% y/o/y, still pretty good relative to pre Covid but that’s the most modest pace since late 2021.
Under the hood though is more helpful to get better color as wage growth accelerated for a ‘job switcher’ to 5% y/o/y, the best since June 2024. And for ‘job stayers’, wage growth was 3.8%, up .2% from February, though well off its highs. This means that wage growth for new entrants is where the slowing is taking place and likely in response to the slowdown in hiring.
Atlanta Wage Growth Tracker
Wage Growth for a ‘job switcher’
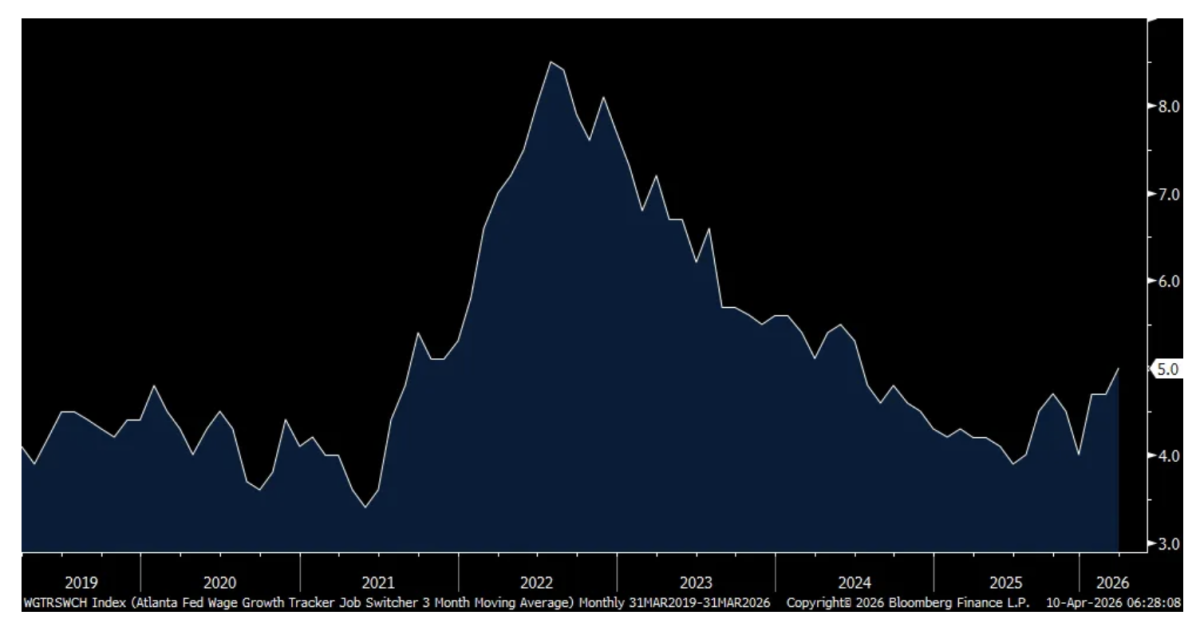
Wage growth for ‘job stayers’
This was of note from the WD-40 earnings call:
“Subsequent to our quarter end, recent geopolitical developments in the Middle East have contributed to the increased costs of certain petroleum based specialty chemicals and other input costs, which will impact our cost of products sold. There is typically a delay of between 90 and 120 days before changes in cost of raw materials impact our cost of products sold, due to production and inventory lifecycles.”
After a rough time for all the alcohol companies, Constellation Brands saw its stock jump 8.5% yesterday (Brown Forman had a big day too as another bidder enters the picture) and they said this of note:
“U.S. consumers, particularly those within lower-income households, continued to face financial pressures from the cumulative effects of inflation, along with ongoing broader economic uncertainty and additional headwinds from other socioeconomic factors. As a result, spending behavior across beverage alcohol categories became more deliberate, with consumers increasingly seeking value and exhibiting greater selectivity in their purchases. Despite these pressures, consumers remained engaged with the category, often trading within portfolios and seeking value through pack sizes and price points rather than exiting the category altogether. Overall demand across beer, wine, and spirits however remained subdued during much of the year.”
“we ended the year with some solid momentum in our beer business, despite operating in a challenging environment during our fiscal ‘26. It was a year that required agility and focus as consumers continued to navigate a tough economic backdrop with more selective shopping behavior, which weighed on overall category performance for much of the year.”
“Our beer portfolio continued to lead the high-end segment with Modelo Especial maintaining its leadership as the number one beer brand by dollars in the United States, and momentum improved as the year progressed.”
“Our Wine & Spirits Business continued to outperform the total wine category in both dollar and volume sales growth across Circana U.S. tracked channels during the fiscal year.”
Taiwan Semi reported Q1 sales growth that exceeded expectations rising 35% with a 45% increase particularly in March. One has to wonder though whether the March spike was a rush in ordering with the war and the helium supply issues that are now a big challenge.
Coincident with this was the March Taiwan export spike of 62%, almost double the estimate of up 35%. Exports to the US in particular skyrocketed by 124% y/o/y.
The Bank of Korea joined other central banks in doing nothing, leaving its rate at 2.50%. Governor Rhee said “From a supply side perspective, the Russia-Ukraine situation mainly affected Europe, whereas the current Middle East situation is having a larger impact on Asia, particularly on economies such as South Korea, Japan and Taiwan that have high dependence on oil. So the supply shock could be greater.”
The South Korean won has also weakened over the past month, along with many other currencies, and “This raises the risk that inflation expectations could become unanchored warranting close attention.”
BY Doug Kass · Apr 10, 2026, 9:30 AM EDT
-SLP +14% (earnings, guidance)
-OGN +11% (reportedly Sun Pharma to proceed with their $12B bid for OGN)
-UXIN +6.0% (earnings, guidance)
-LITE +5.5% (CEO: Company has sold out products through 2027)
-CRWV +4.4% (strength attributed report Anthropic will rent CoreWeave capacity to power Claude)
-MRVL +3.7% (hearing Oak Thistle LLC has taken a position)
-WPP +3.7% (reportedly explores sale of public relations unit, primarily Burson)
-SHAK +3.5% (earnings, guidance)
-SNDK +2.6% (Mizuho Securities Raised SHAK to Outperform from Neutral, price target: $120)
-TSM +2.3% (reports revenue)
-ANGX -23% (prices 14.3M shares at $2.10/shr in ~$30M offering)
-DOCU -2.1% (CitiGroup Cuts DOCU to Neutral from Buy, price target: $50 from $99)
-WDFC -1.7% (earnings, guidance)
None.
BY Doug Kass · Apr 10, 2026, 9:19 AM EDT
BY Doug Kass · Apr 10, 2026, 8:58 AM EDT
BY Doug Kass · Apr 10, 2026, 8:22 AM EDT

None.
BY Doug Kass · Apr 10, 2026, 8:12 AM EDT
Chart of the Day: SMH
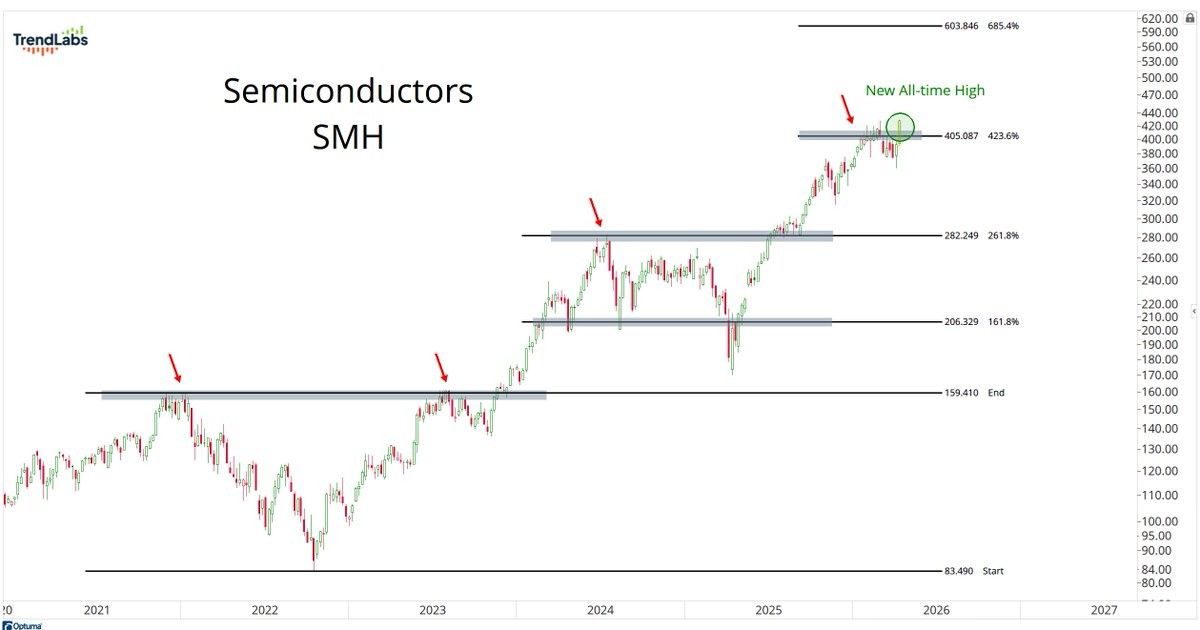
Semiconductors (SMH) closed at new all-time highs today,
After clearing its prior cycle highs in late 2023, semiconductors have stair-stepped higher, using the Fibonacci extension levels as guideposts along the way.
The performance gap between semiconductor and software stocks also continues to widen, with
The Takeaway: Semiconductors remain a key leadership group, with new highs helping to drive the market's recovery.
- J.C. Parets (@JC_ParetsX) / X
Ratio chart of Software / S&P 500. My god. pic.twitter.com/IJo9s1SOTf
— Matt Cerminaro (@mattcerminaro)
Meanwhile, technology sector insiders keep buying (The chart shows the total number of corporate insiders of companies covered by the XLK ETF that have bought shares on the open market during the past six months). Make of it what you will. @sentimentrader pic.twitter.com/p6wCQSpVAe
— Jay Kaeppel (@jaykaeppel)
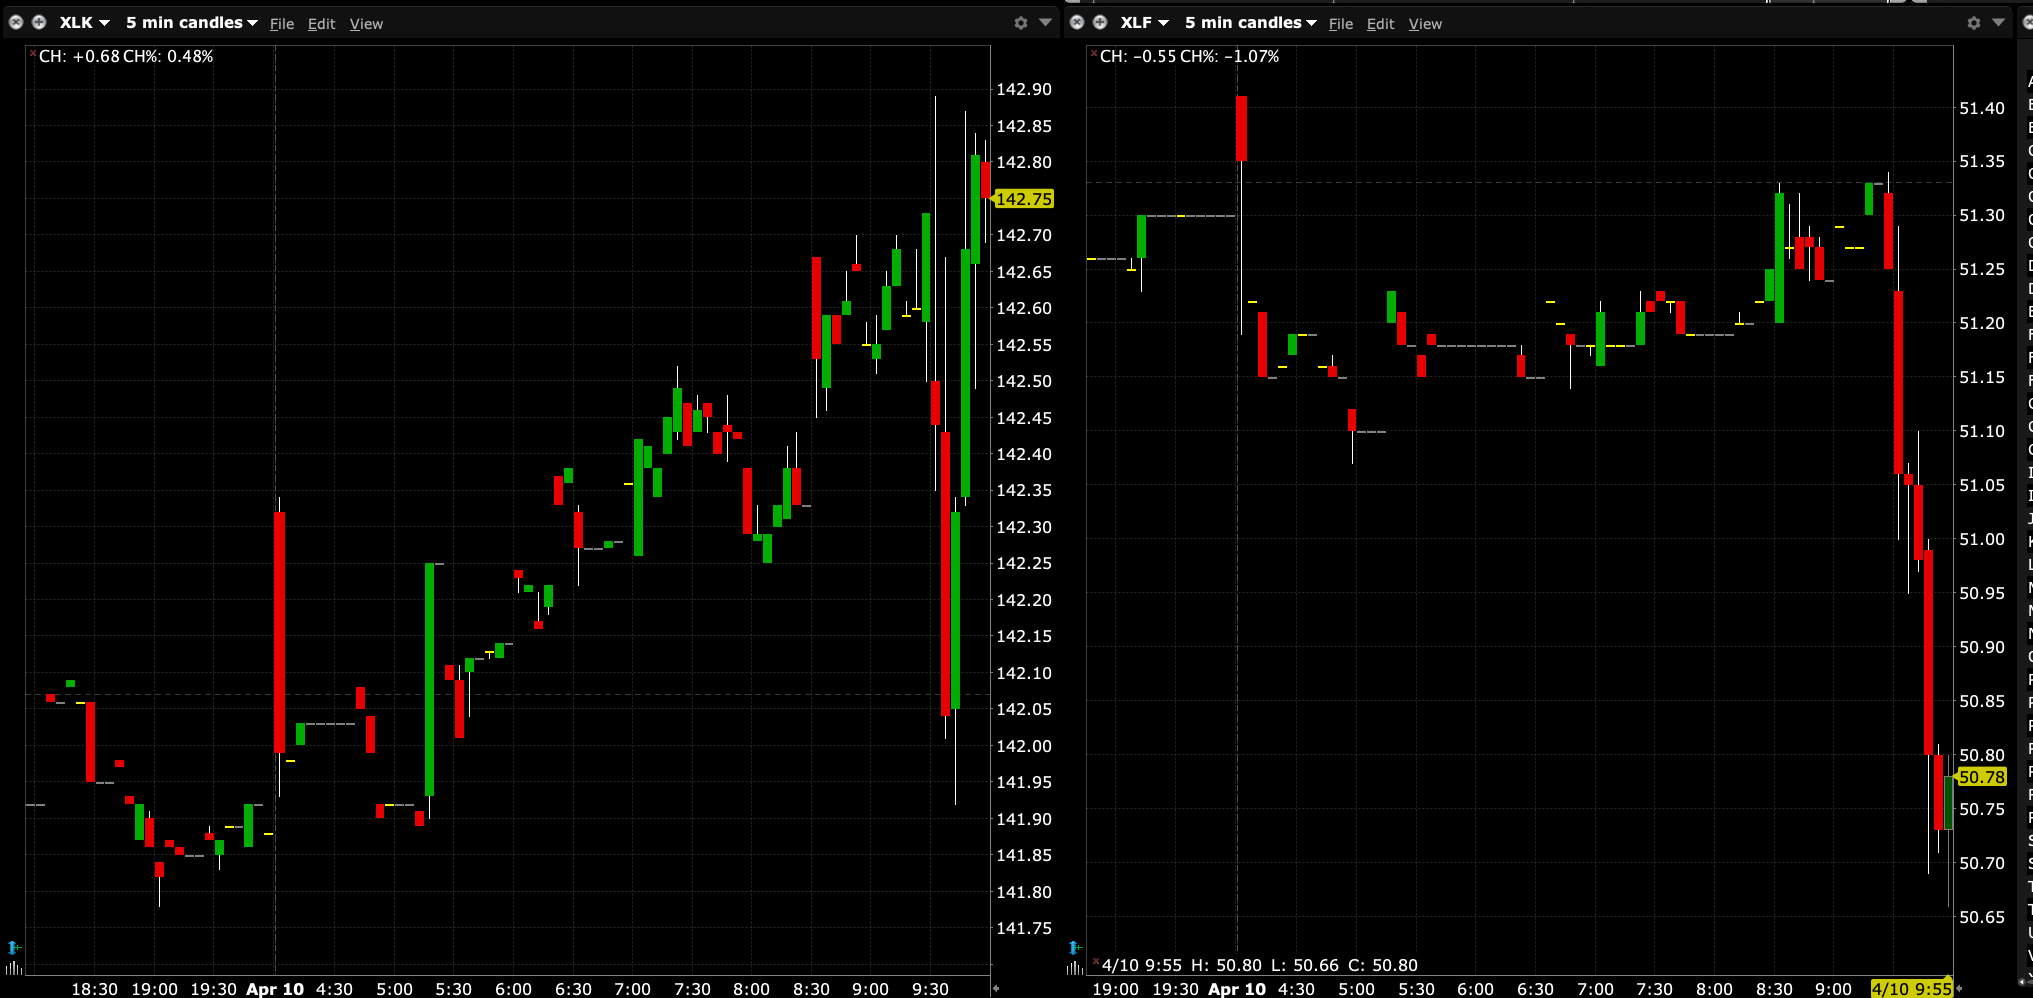
Financials had the largest percentage of stocks making new 20d highs yesterday. $XLF pic.twitter.com/QtHvBiT6ao
— Randy Dunham (@itmrandy)
It is not just Software investors that are returning to their pre-Iran mentality. Oil services $OIH are recapturing the rotation from Producers $XOP with the view that the infrastructure buildout that is required over the next few years is likely to be substantial following… pic.twitter.com/aLPJwE6PE7
— Equity Clock (@EquityClock)
#BTC #Bitcoin 1Y of PA continues to resemble more and more the previous bottoms (2015/2018/2022), with an average forward return of +55% six months from today. These have been the best opportunities to accumulate.
— Orion Engine (@TheOrionEngine)
The neat thing about using tools like the Orion Engine when fear… pic.twitter.com/20CogjC7TV
Bonus — Here are some great links:
BY Doug Kass · Apr 10, 2026, 6:45 AM EDT
From Wolf Street...
BY Doug Kass · Apr 10, 2026, 6:35 AM EDT
BREAKING: President Trump says Iran is doing a “very poor job, dishonorable some would say, of allowing oil to go through the Strait of Hormuz.”
— The Kobeissi Letter (@KobeissiLetter)
“That is not the agreement we have,” Trump says. pic.twitter.com/tSOKyZFRzh
BY Doug Kass · Apr 10, 2026, 6:25 AM EDT
I have a business meeting from 8 AM to 9:30 AM this morning.
BY Doug Kass · Apr 10, 2026, 6:15 AM EDT
From Jazzy Jeff Hirsch and the Stock Trader's Almanac:
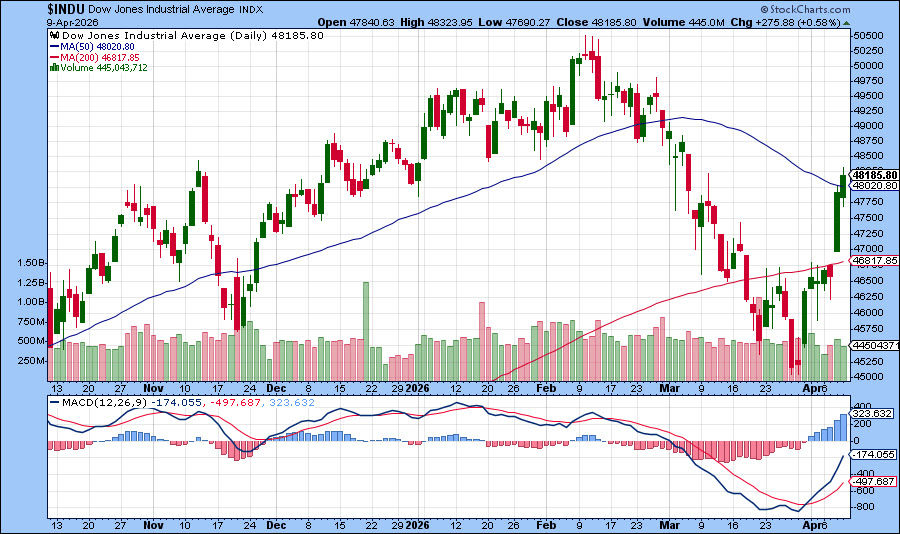
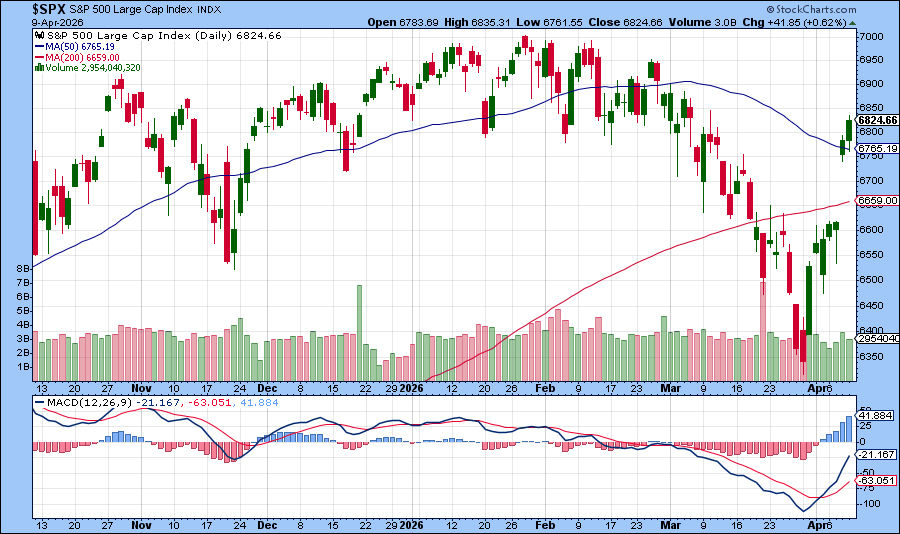
In the April 2026 Outlook Issue and its associated member’s webinar we observed the market was at a seasonal crossroads. April is the final month of the Best Six Months for DJIA and S&P 500 and it is also the beginning of the Weak Spot of the 4-Year Cycle during midterm year Q2-Q3, but late-March to early April has also been where the seasonal low during Trump-presidency years has typically formed.
The announcement of a two-week cease fire between the U.S. and Iran earlier this week and the resulting surge higher by the market has potentially put in an early spring market low. Whether or not the S&P 500’s March 30 close at 6343.72 is the final low of the year remains to be seen, but in the near-term the path of least resistance for the market does appear to be higher.

While geopolitical risks and energy markets remain key variables, the market appears to be absorbing these shocks more efficiently than many expected. If that continues—and especially if uncertainty continues to ease even modestly—the backdrop appears to be in place for the market to continue to push higher in the weeks ahead. Economic growth is still holding up, the labor market still appears to be on reasonably solid footing and although the outlook for Fed interest rate cuts is shifting, the Fed is still effectively neutral with monetary policy.
How high in the near-term? Depending on news headlines (and earnings results), S&P 500 could find its way back to around its old all-time closing highs reached in mid-February, which would be around 2-3% higher than its current level. Ride the rally and we will wait until the Seasonal MACD Sell signal to consider taking additional portfolio actions.
Seasonal MACD Sell Signal Update
As of today’s close, MACD indicators applied to DJIA and S&P 500 are positive. DJIA would need to drop 5544.66 points (–11.51%) in a single day to turn its MACD indicator negative while S&P 500 would need to decline 733.05 points (–10.74%) to turn its MACD indicator negative. Continue to hold long positions associated with DJIA’s and S&P 500’s “Best Six Months.” We will issue the Seasonal MACD Sell signal when corresponding MACD Sell indicators applied to DJIA and S&P 500 both crossover and issue a new sell signal.
As a reminder to long-term and a refresher for new members, the criteria to issue our Seasonal MACD Sell signal for DJIA, and S&P 500 is a new sell signal on or after the first trading day of April and both DJIA and S&P 500 have to agree. The confirmation by both DJIA and S&P 500 is part of the criteria. For example, if DJIA’s Seasonal MACD indicator turns negative on a given day on or after April 1, but S&P 500’s does not, then there is no signal on that day. Both must be negative.
Our Seasonal MACD Sell indicator is calculated using daily closing prices with a short exponential moving average (ema) of 12, a long ema of 26 and a 9-period ema for the signal line. This is frequently written as 12-26-9 or in the accompanying charts as 12, 26, 9.
BY Doug Kass · Apr 10, 2026, 6:05 AM EDT
Short-term Calendar Vol smoked into a CPI Event Risk Day (rarely happens, but that's because Tourists are "trading the war" not higher for longer inflation, yet) pic.twitter.com/9FIzEeOyfW
— Keith McCullough (@KeithMcCullough)
BY Doug Kass · Apr 10, 2026, 5:55 AM EDT
The S&P Short Range Oscillator remains in deep overbought at 3.33% vs. 3.19%.
Position: Short SPY common (VS), QQQ common (VS)
BY Doug Kass · Apr 10, 2026, 5:45 AM EDT
BREAKING: President Trump says Iran is doing a “very poor job, dishonorable some would say, of allowing oil to go through the Strait of Hormuz.” “That is not the agreement we have,” Trump says.

Attention Homegamers... @KeithMcCullough analysis or the $VIX risk range (yesterday and today) was worth the price of @hedgeye admission. Look what happened to equities at about 10:30 AM when the VIX, at first broke support at 19.05- 19.10 (it went to 18.83) but then quickly Show more

Short-term Calendar Vol smoked into a CPI Event Risk Day (rarely happens, but that's because Tourists are "trading the war" not higher for longer inflation, yet)

Ratio chart of Software / S&P 500. My god.

Financials had the largest percentage of stocks making new 20d highs yesterday. $XLF

Meanwhile, technology sector insiders keep buying (The chart shows the total number of corporate insiders of companies covered by the XLK ETF that have bought shares on the open market during the past six months). Make of it what you will. @sentimentrader

Chip, dip, leadership. $SOXX

Short-term Calendar Vol smoked into a CPI Event Risk Day (rarely happens, but that's because Tourists are "trading the war" not higher for longer inflation, yet)