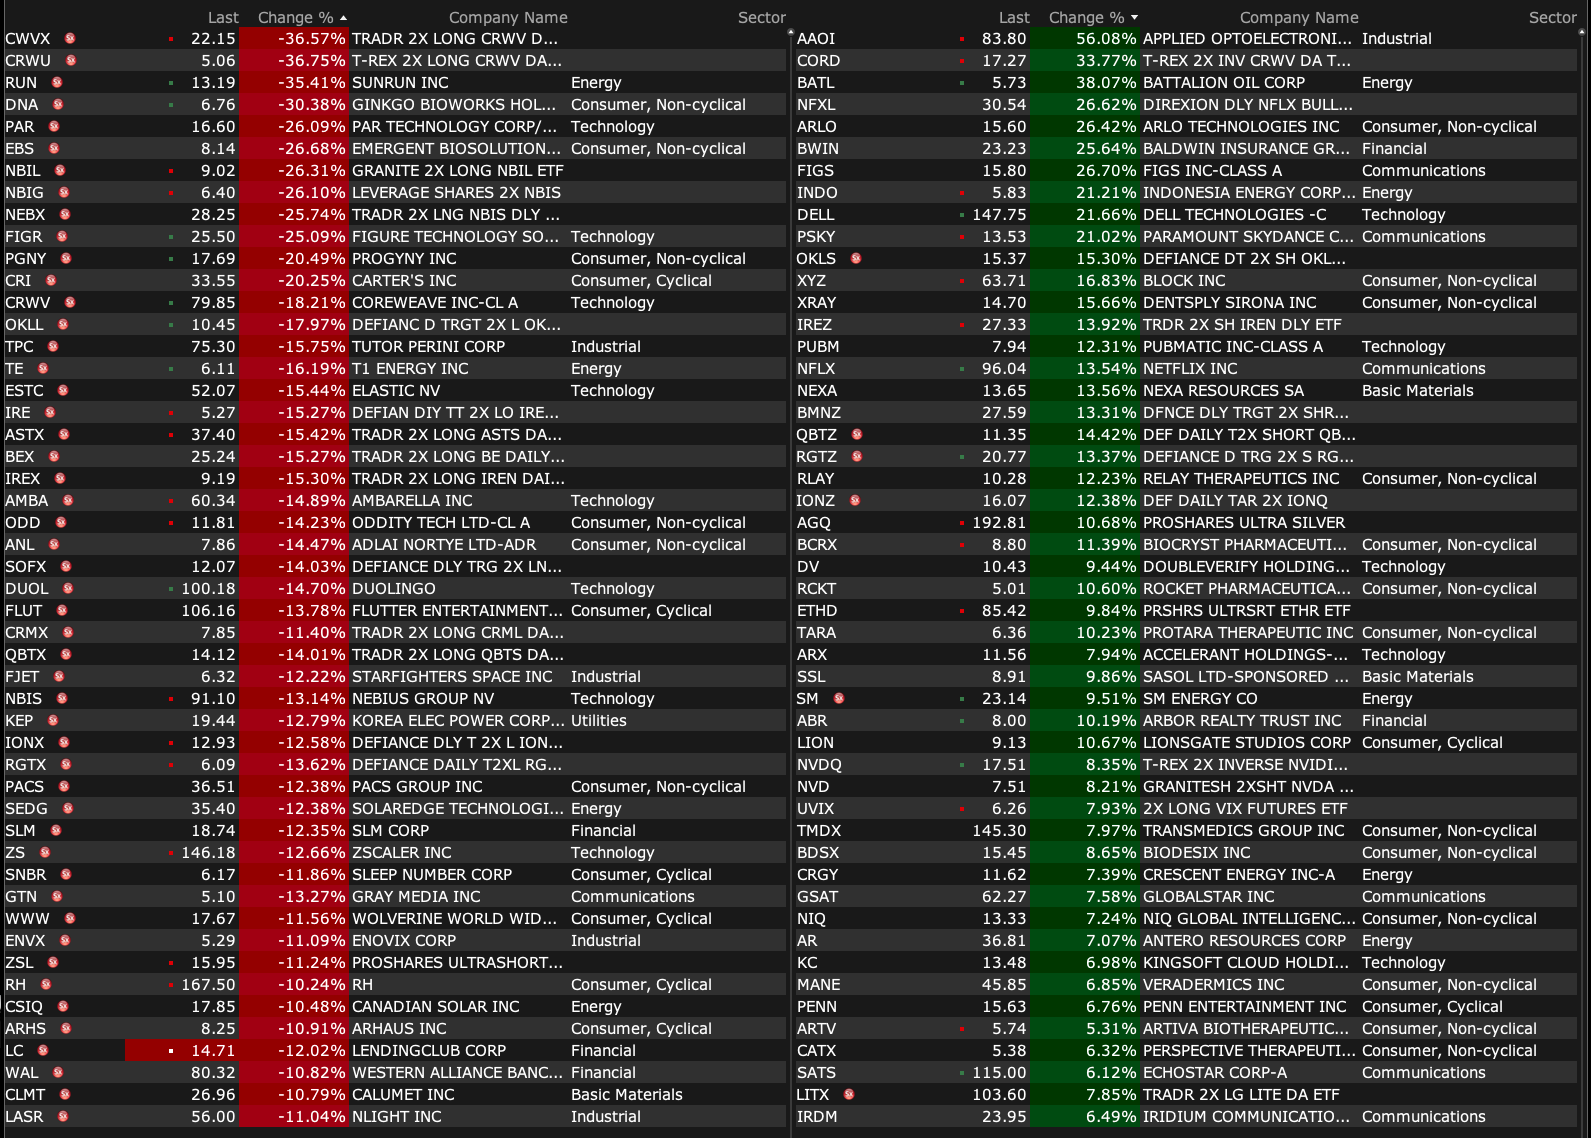
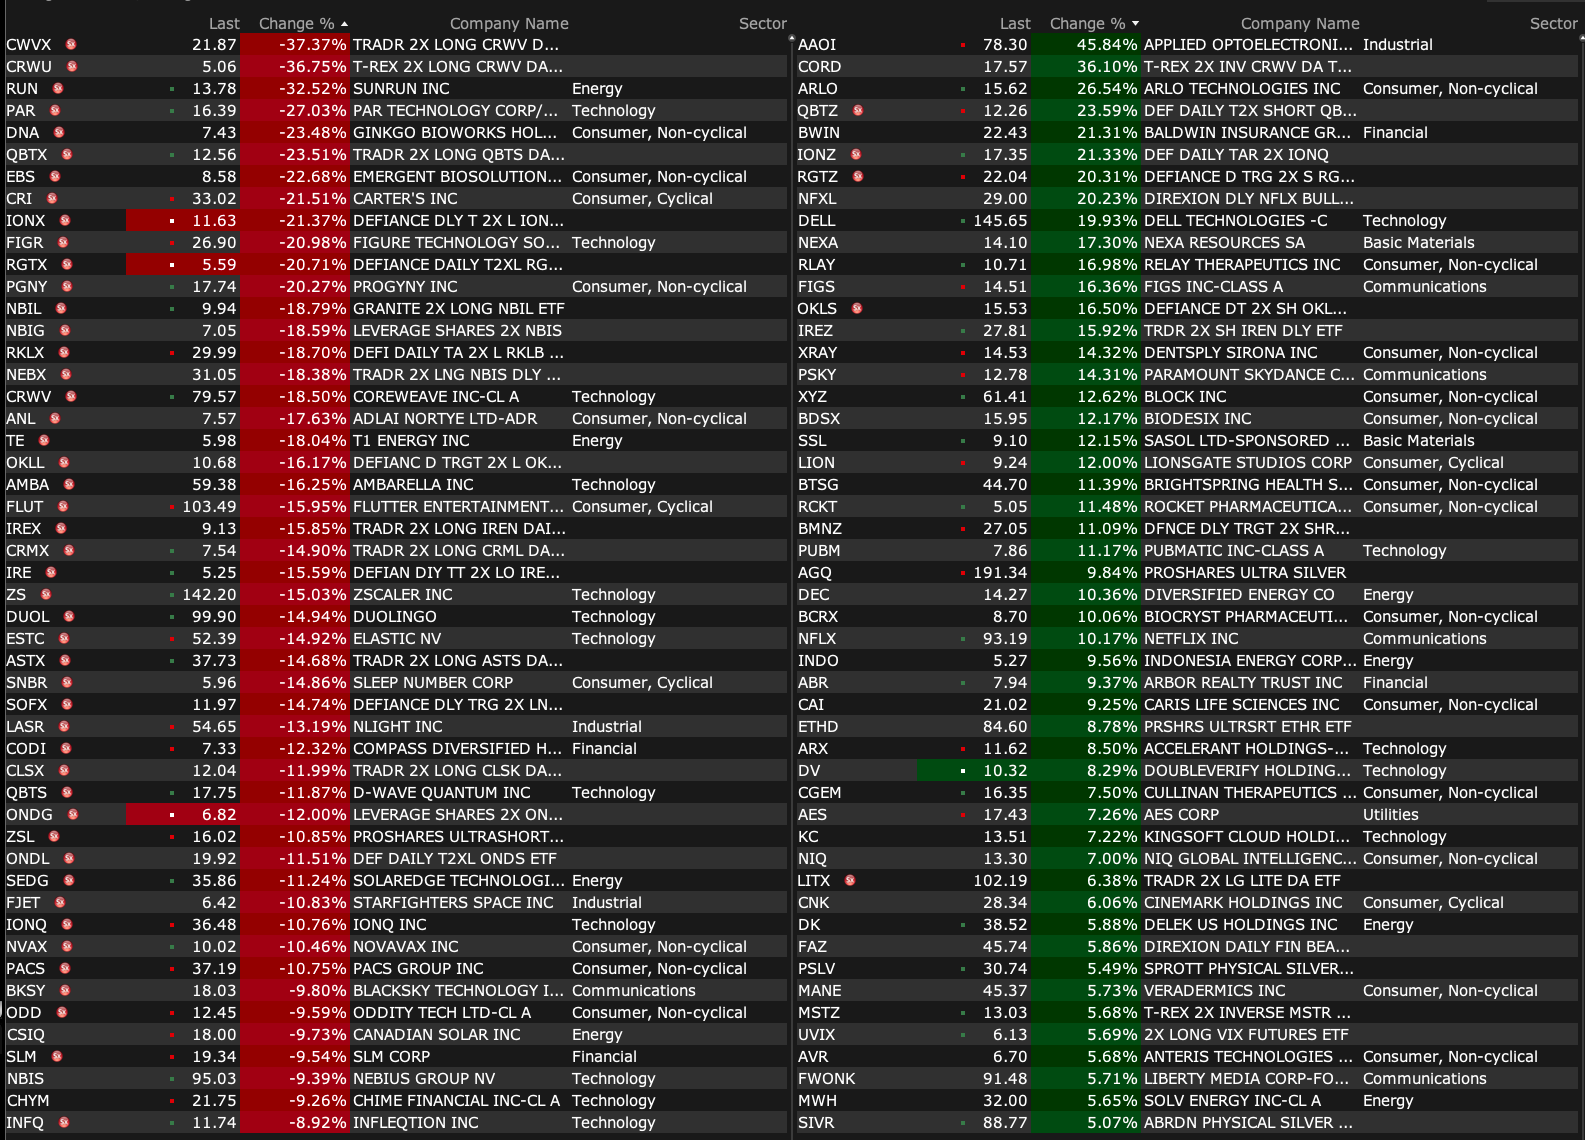
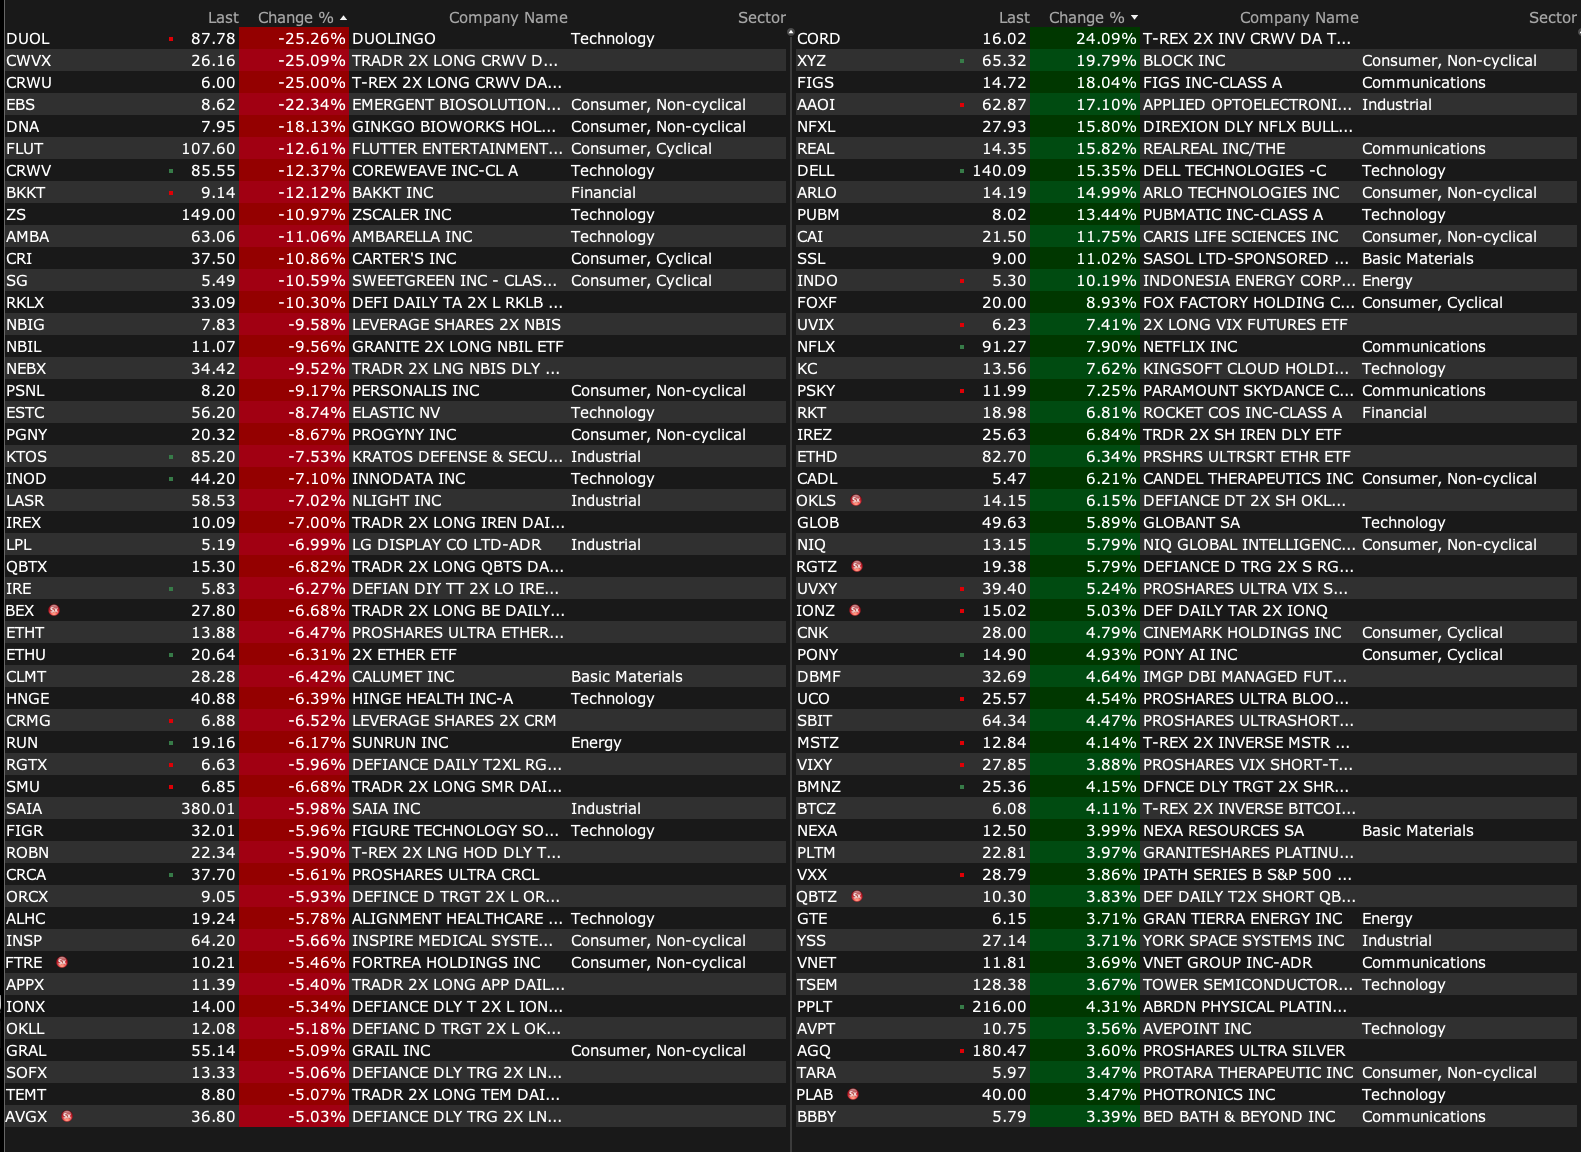
After-Hours Advancers and Decliners
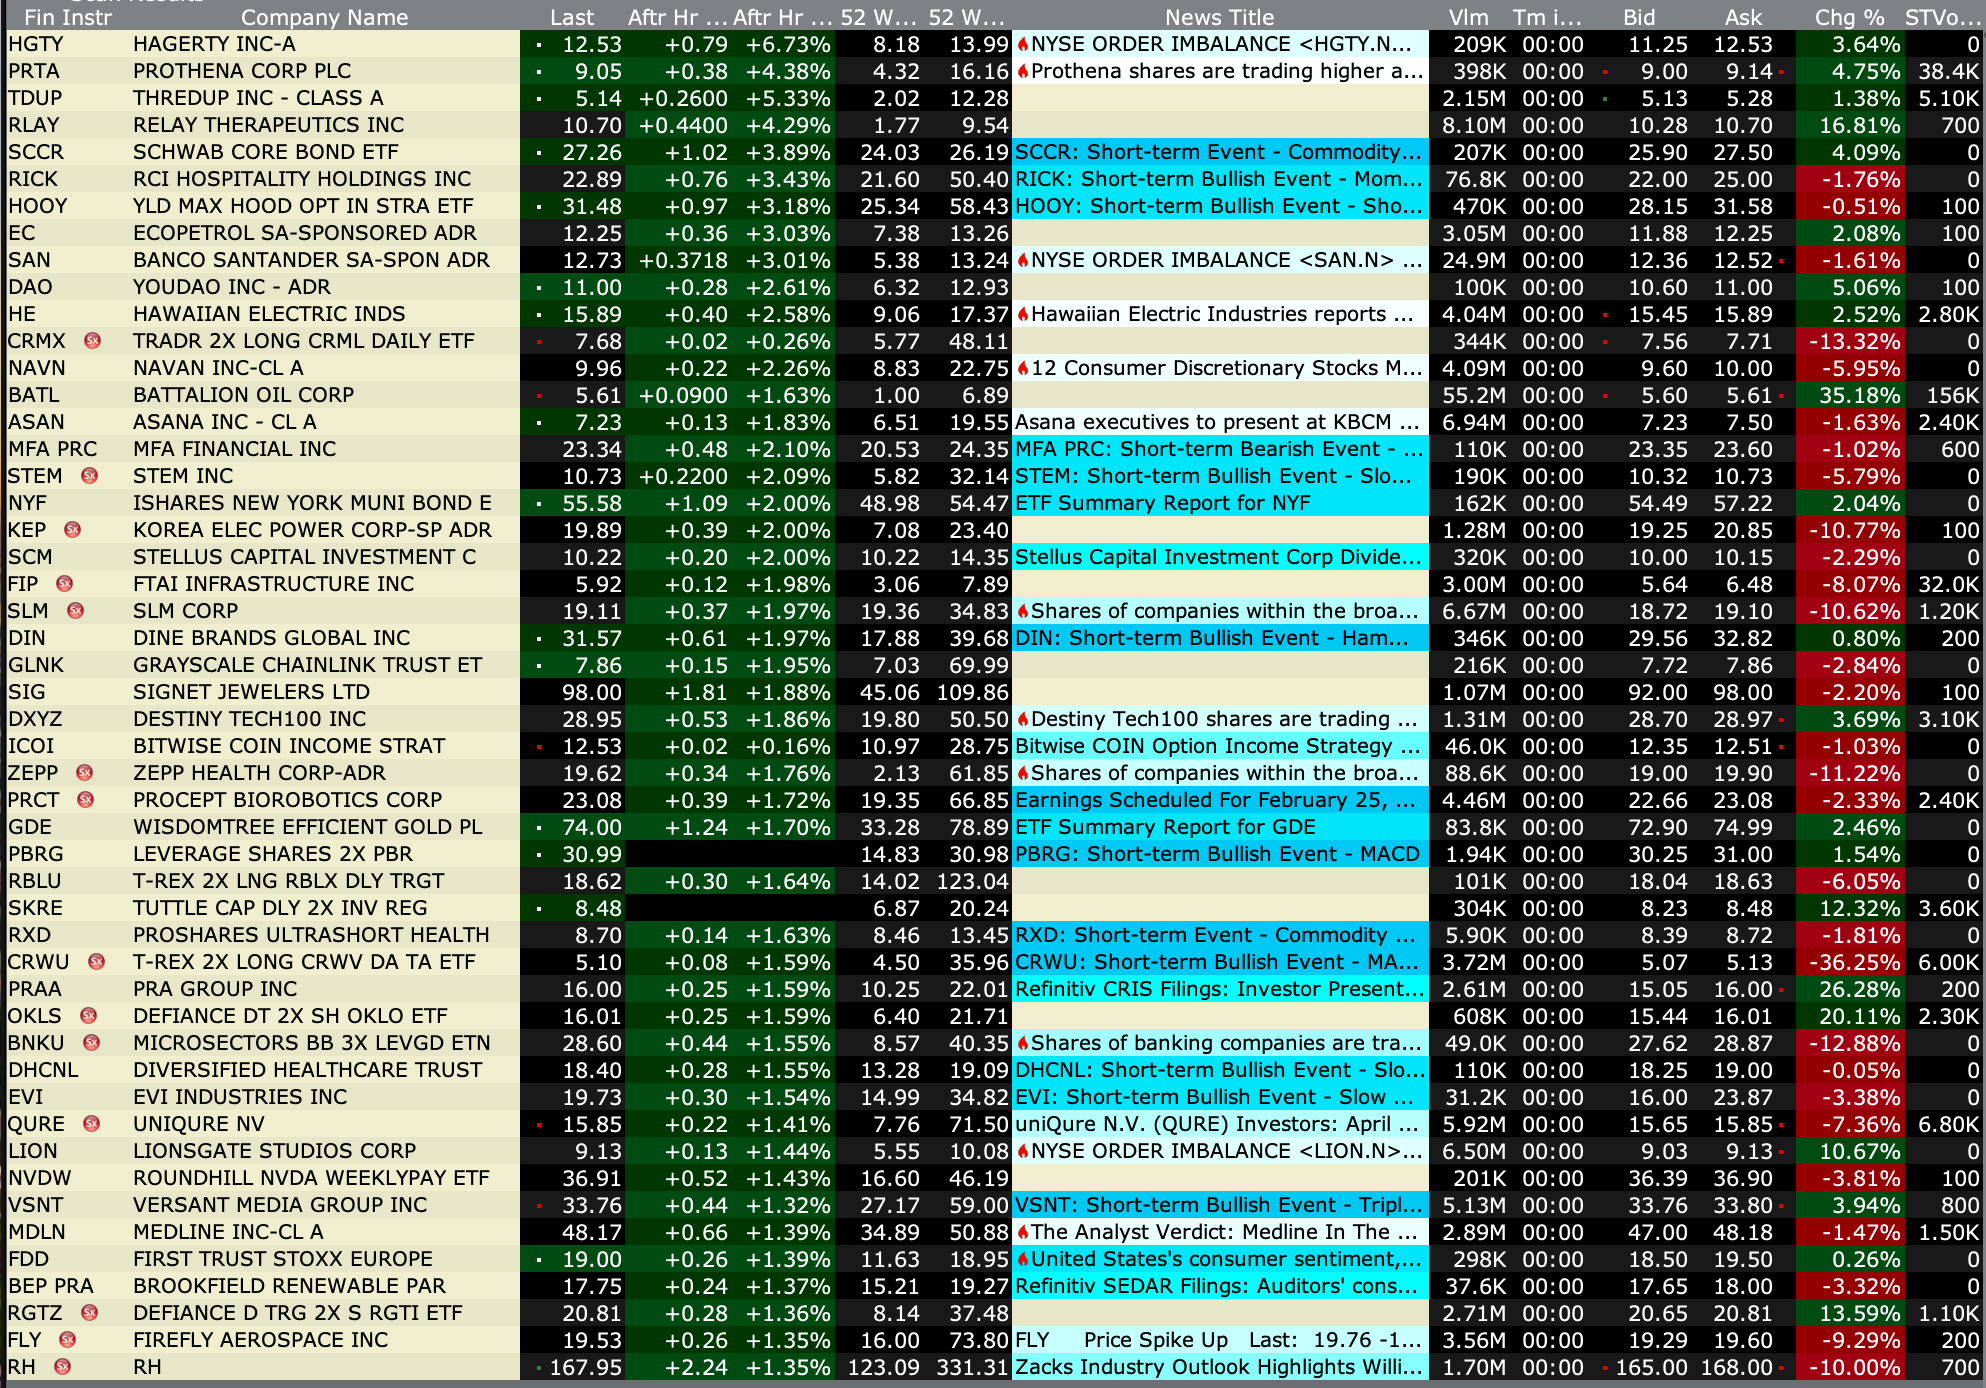
After-Hours % Advancers
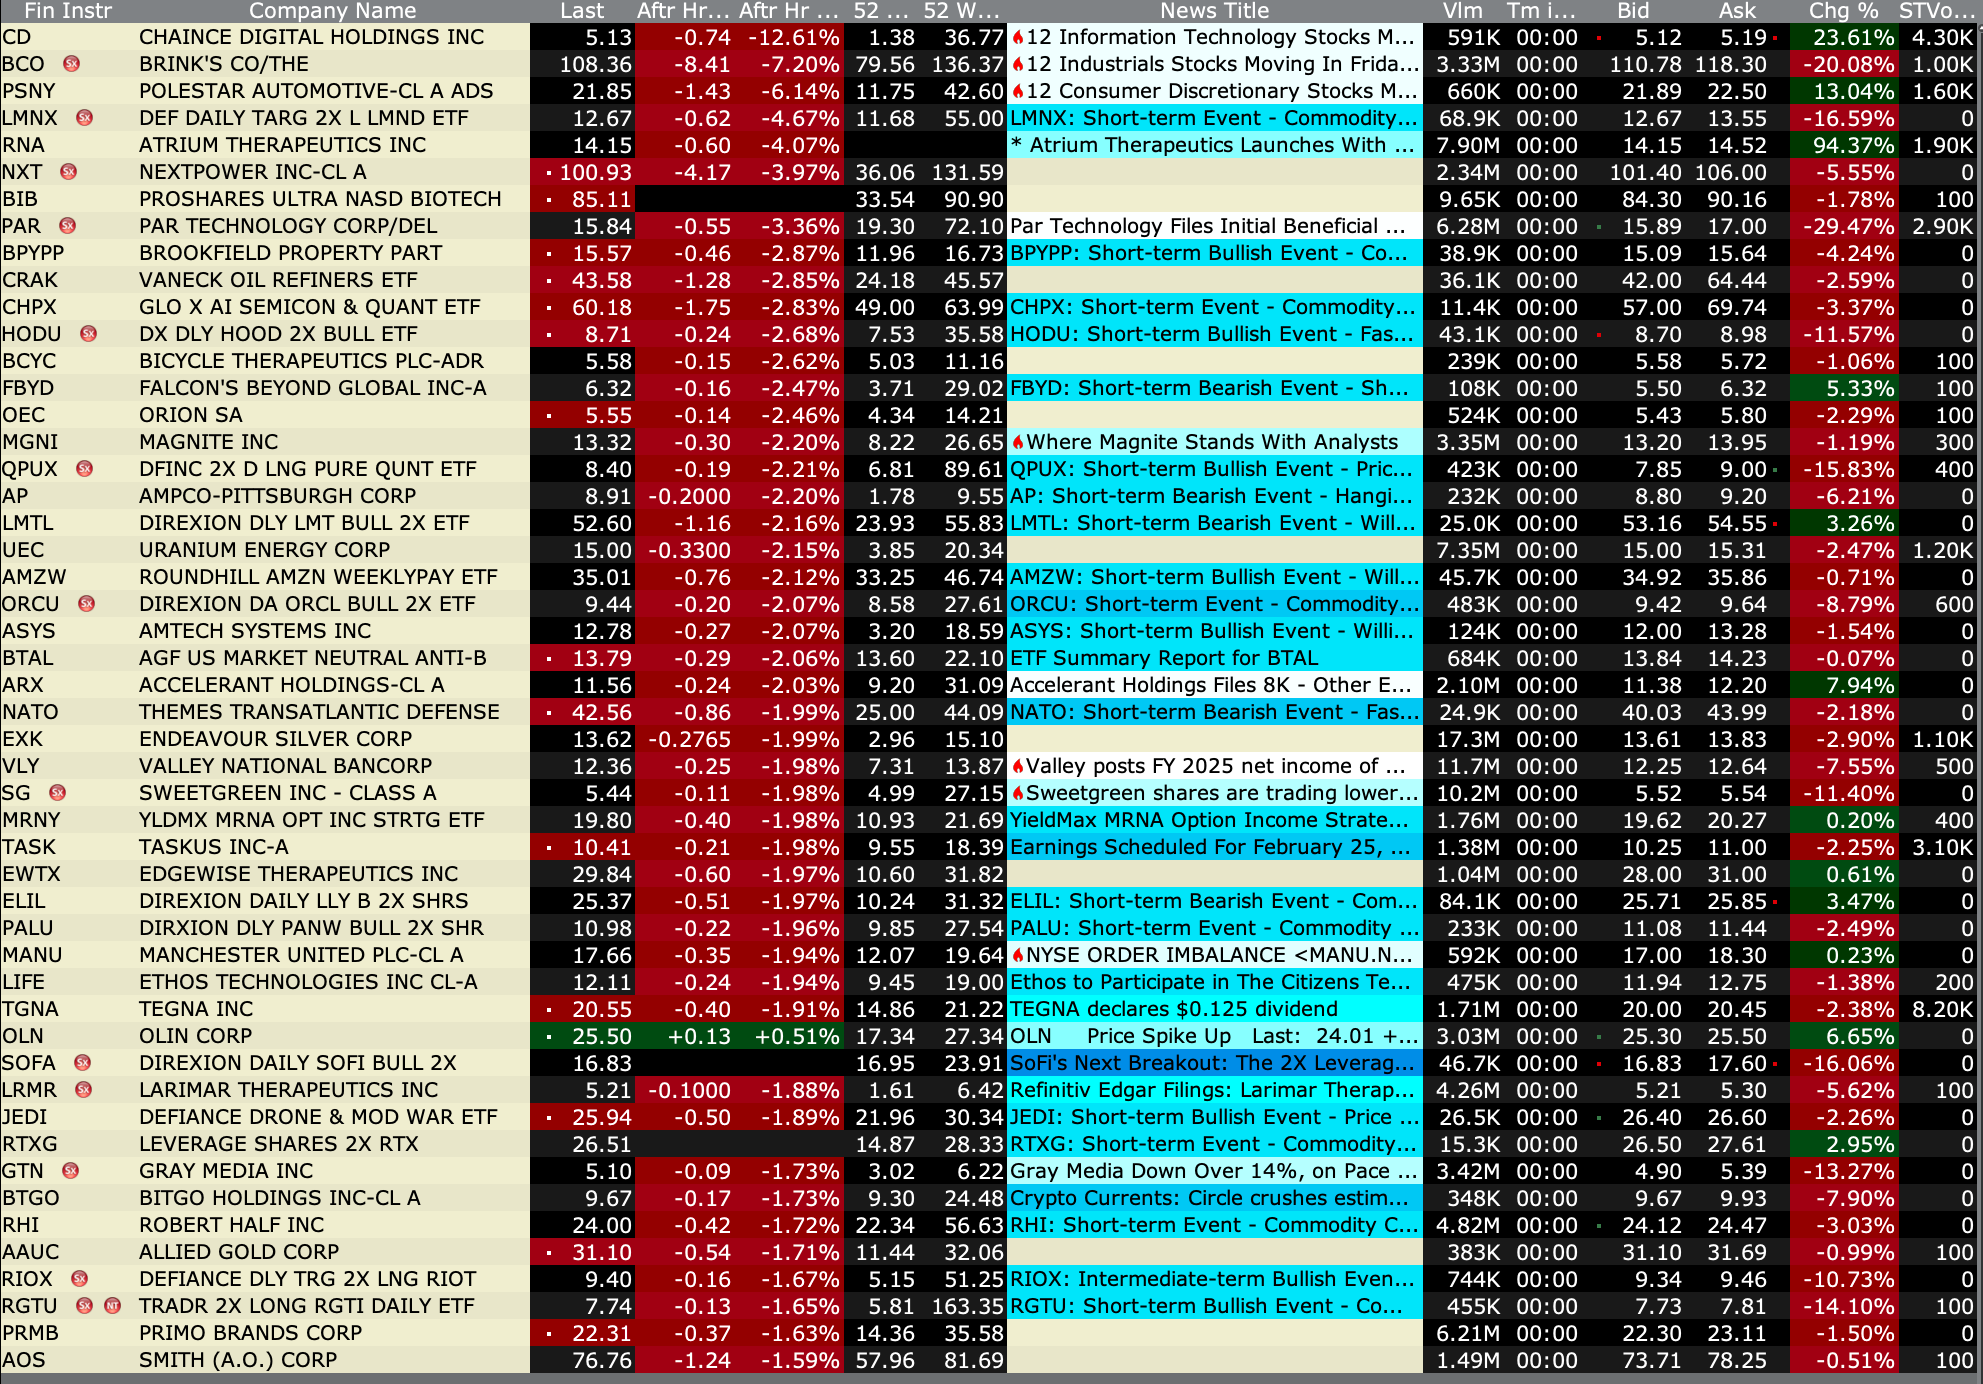
After-Hours % Decliners
BY Doug Kass · Feb 27, 2026, 4:40 PM EST
BY Doug Kass · Feb 27, 2026, 4:40 PM EST
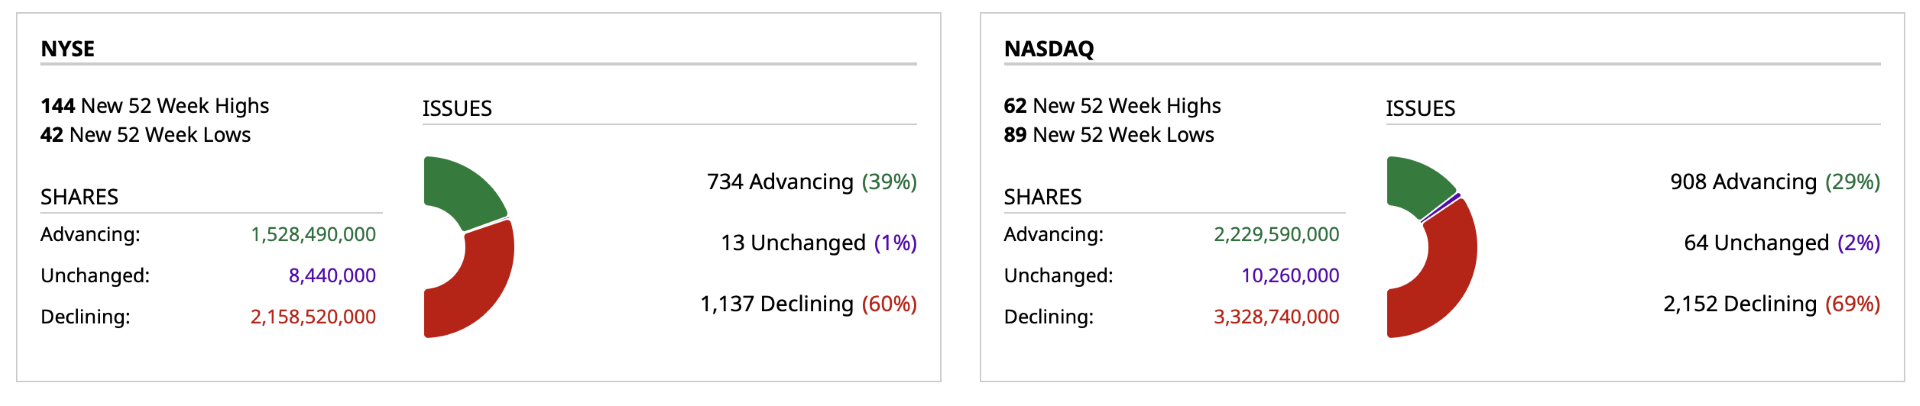
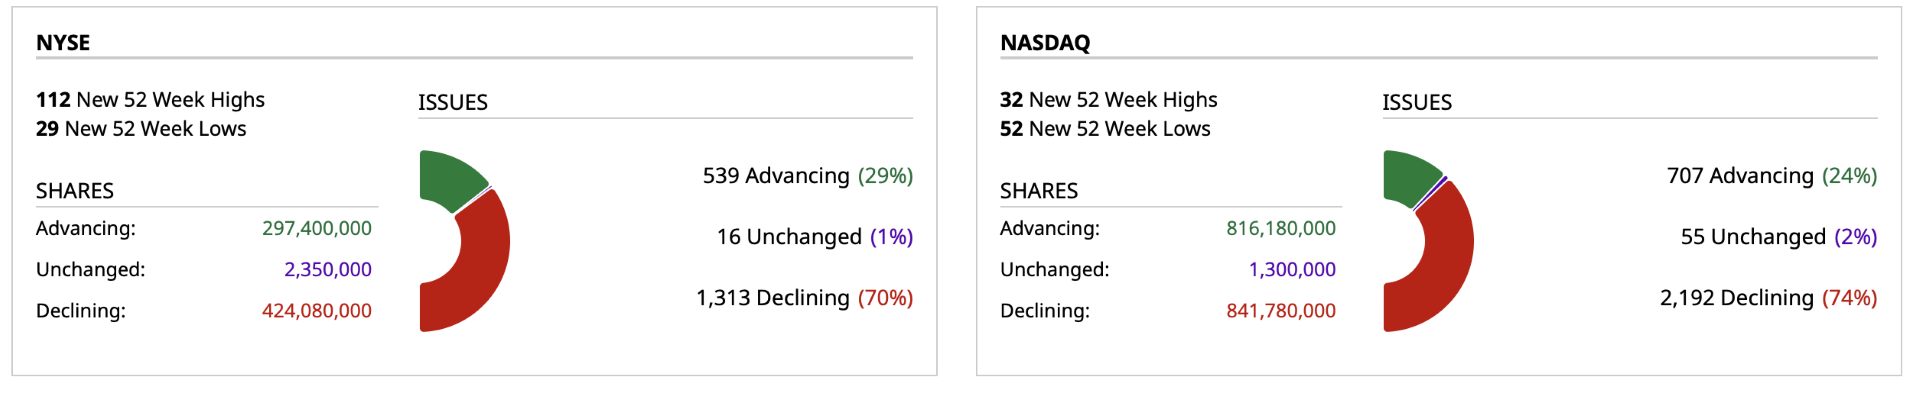
- NYSE volume 9% below its one-month average
- NASDAQ volume 3% below its one-month average
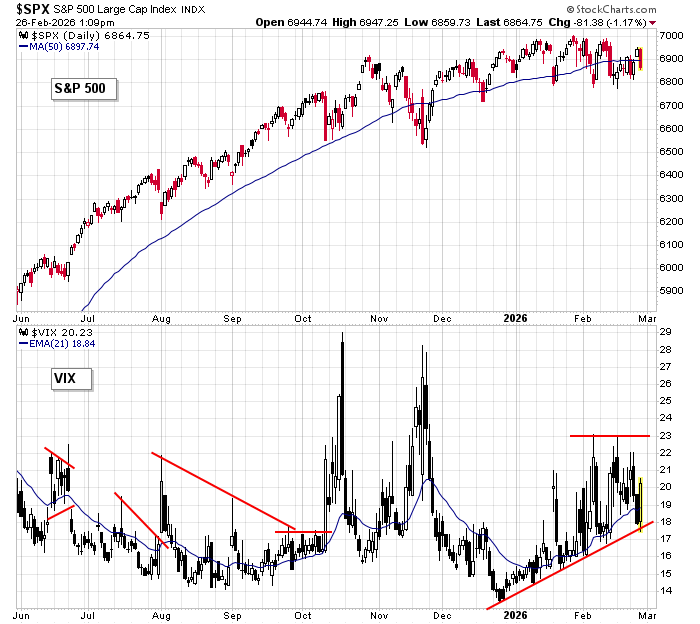
- VIX index: up 6.98% to 19.93
BY Doug Kass · Feb 27, 2026, 4:25 PM EST
* I am approaching 200 "More Tales"... Oh, my!
I think at this point it is clear the singularity has become the circularity.
OpenAI got their deal done. Of course it is related parties that either depend on OpenAI for revenue or need the mark on their books to go up as opposed to zero.
I disagree with the opening sentence in the following tweet to some degree. I do not think Sam Altman convinced anyone of anything on a business or a fundamental basis. I think the conversation was more like “If I go down, you are going down with me.”
I also do not think the investors can be described as sophisticated either, especially with regard to their motivations in this case. Do you call a heroin addict that needs more heroin to stay high sophisticated? Valuations should not be stepped up to massive levels for businesses that constantly miss plan on every metric (technological and financial), that are high-cost players in what looks to be a commoditizing industry, and that are share losers:
At the same time, after the disaster quarter from CoreWeave (CRWV) (-$22 or -23%...we remain short!), not a single downgrade as best as I can tell. They seem like one of the next in the circle to need a cash infusion from those that need them to buy their products. Given how the CDS are trading, it seems doubtful to me that cash can come from the credit markets. Perhaps the analysts that didn’t downgrade think a secondary might be coming, and they want the business for their firms? But boy, once the float starts increasing on this thing, who knows. And given how the IPO went, it is anybody’s guess what price the market will set. Will be interesting how this one goes:
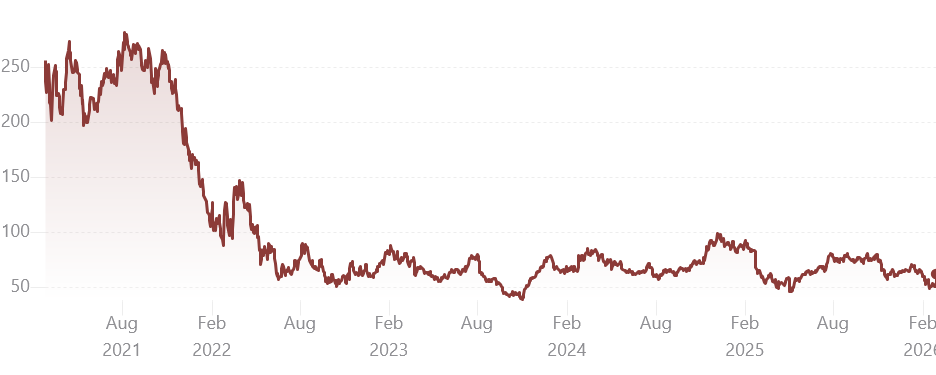
Then back to the subject of Block (XYZ) . Do they need AI to not throw $68 million parties for their employees, that they then need to fire? What caused them to pay through the nose and acquire a buy now, pay later company at the peak and pay an amount that is close to what the entire market cap of the company is today? What a load of crap.
Here is what the stock price has done. No pulse ex the hit from the defibrillator today:
BY Doug Kass · Feb 27, 2026, 3:30 PM EST
* Caveat emptor, IPO flippers!
* GENB IPO priced at $16 is now trading under $12...
Generate Biomedicines (GENB), a Goldman Sachs IPO, was priced at $16/share.
Generate Biomedicines, Inc. Announces Pricing of Initial Public Offering
BY Doug Kass · Feb 27, 2026, 3:02 PM EST
BY Doug Kass · Feb 27, 2026, 2:35 PM EST
Professor Galloway's "No Mercy No Malice": The Epstein Tax.
BY Doug Kass · Feb 27, 2026, 2:22 PM EST
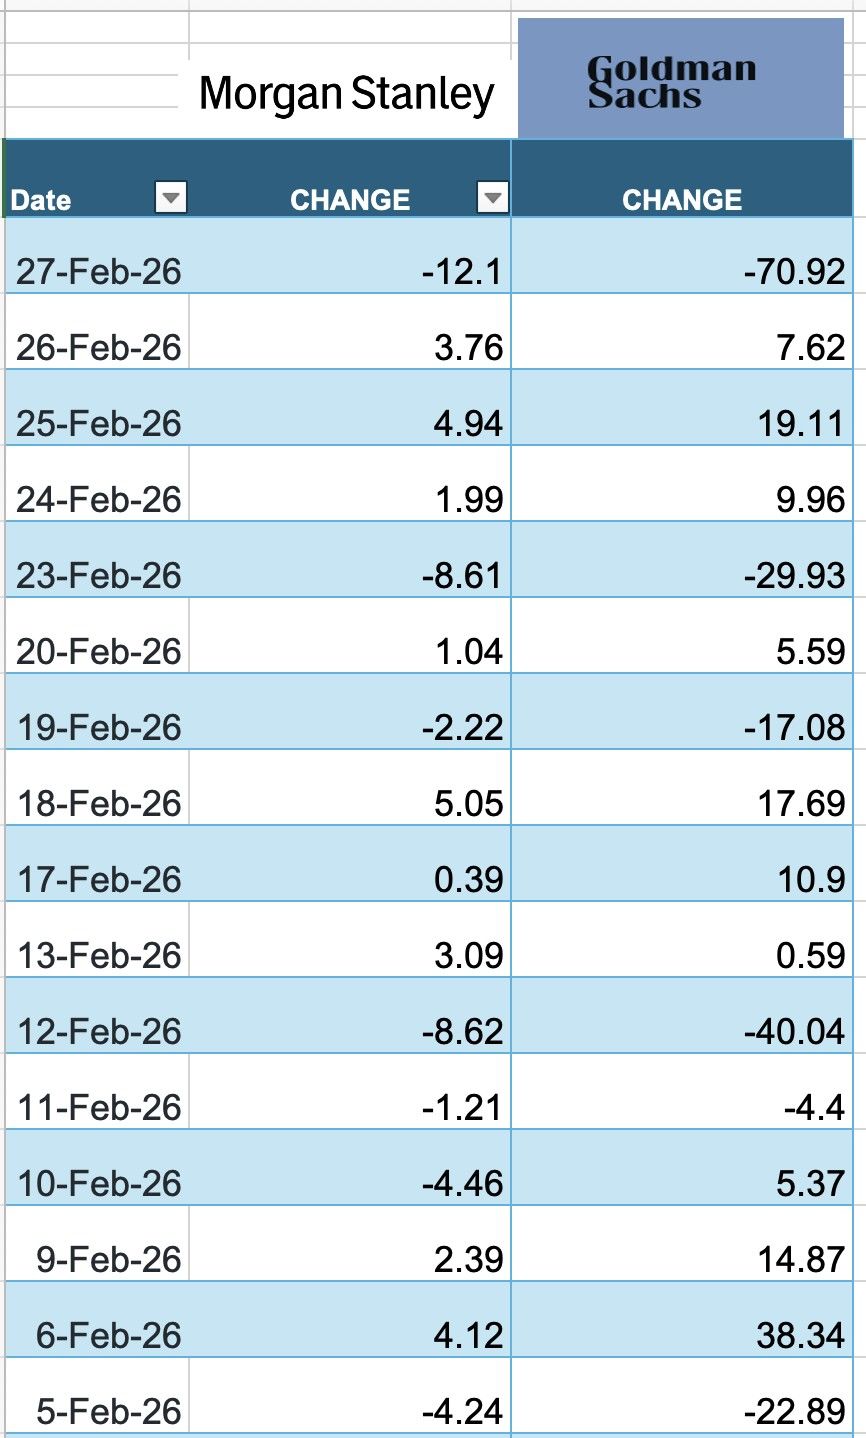
The daily dollar price changes of Morgan Stanley (MS) and Goldman Sachs (GS) shares over the last 16 trading days is truly astonishing and random — in the market without memory from day to day:
BY Doug Kass · Feb 27, 2026, 1:50 PM EST
BY Doug Kass · Feb 27, 2026, 1:39 PM EST
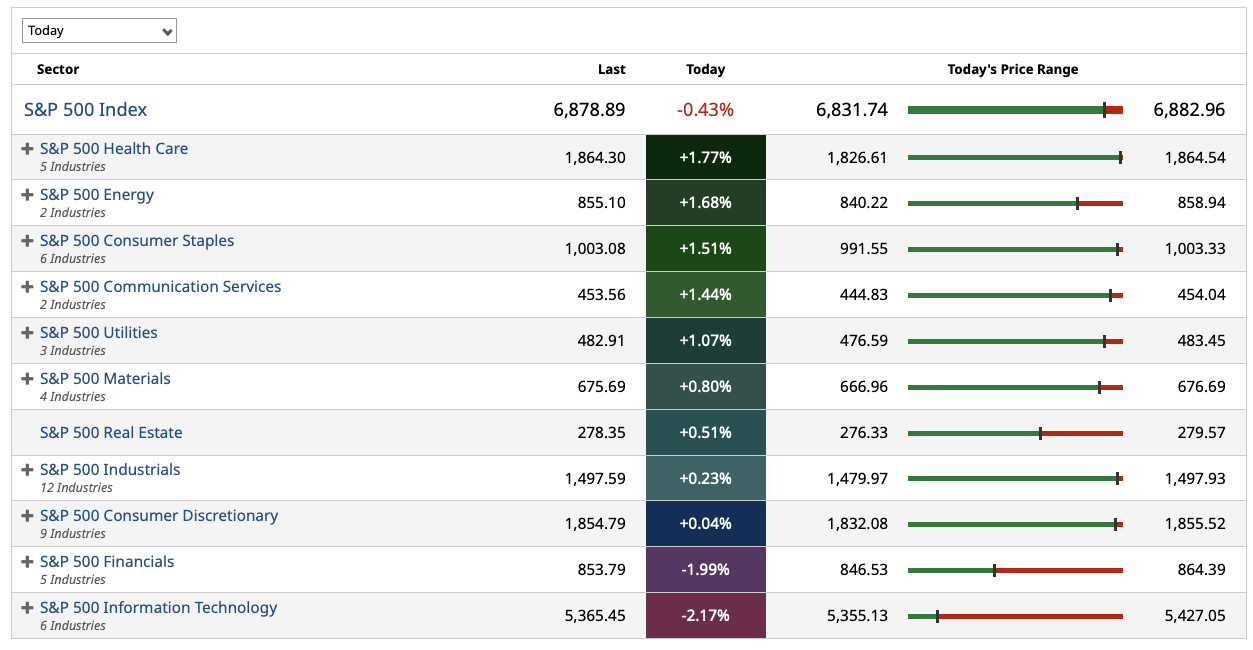
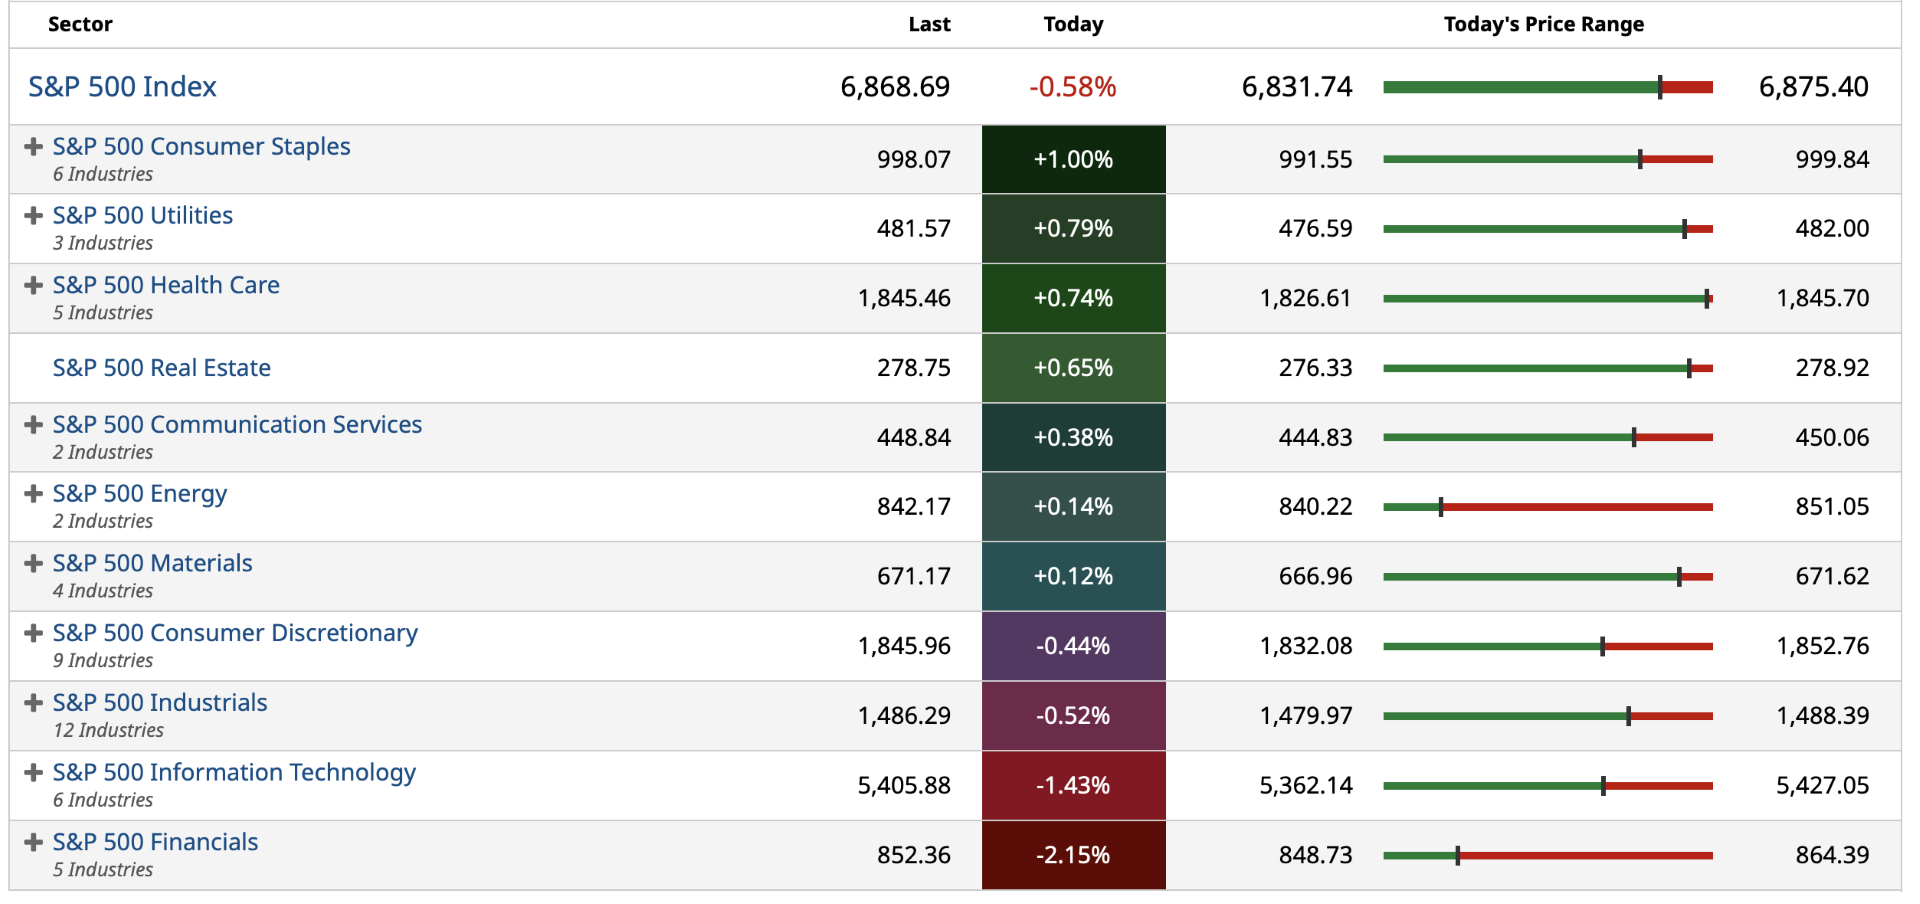
Consumer staples continue to lead the league today.
BY Doug Kass · Feb 27, 2026, 1:11 PM EST
The market with no memory from day to day.
BY Doug Kass · Feb 27, 2026, 12:23 PM EST
BY Doug Kass · Feb 27, 2026, 11:51 AM EST
I remain short the name:
BY Doug Kass · Feb 27, 2026, 11:30 AM EST
* In the market without memory from day to day...
BY Doug Kass · Feb 27, 2026, 10:49 AM EST
From Peter Boockvar:
January PPI rose .5% m/o/m headline, 2 tenths above the estimate but partly offset by a one tenth downward revision to December but which still showed a .4% rise. The core rate jumped by .8% m/o/m which was 5 tenths higher than forecasted after rising by .6% in
December (revised lower by one tenth). Versus last year, the headline gain was 2.9% vs 3% last month while the core rate jumped by 3.6% y/o/y vs 3.3% in the month before.
The headline number was tempered by declines in food and energy prices but prices rose elsewhere.
Core goods prices rose .7% and are now up 4.2% y/o/y. The BLS said “the index for search, detection, navigation, and guidance systems jumped 15.5%.” I need to dig in to what that actually entails.
Services prices also popped, by .8% m/o/m and by 3.4% y/o/y. The BLS attributed a lot of the gain to a rise in margins for professional and commercial equipment wholesaling but also in apparel, footwear and accessories retailing, chemicals and allied products wholesaling, telecom services, health, beauty, and optical goods retailing along with food, alcohol retailing. On the flip side, system software publishing prices fell 12.2%. AI driven? I don’t know.
Bottom line, I’ll say this again, just because price pressures don’t necessarily show up in consumer price inflation doesn’t mean there isn’t cost/price inflation. I’m not going to get into a debate over what influence tariffs had on this data, as I’m sure it did, but either way, cost pressures remain widespread with the main question being who is eating it. You or them.
The reaction in Treasuries is mostly in the TIPS market as the 2 yr inflation breakeven is rising by 4 bps to 2.84%, matching the highest since April 2025. The 5 yr is up by 2 bps to 2.50%. The 10 yr is higher by 1 bps to 2.29%. The US 10 yr yield is still below 4% at 3.99% but traded 3.97% right before this report.
BY Doug Kass · Feb 27, 2026, 10:12 AM EST
I covered half of my CoreWeave short (CRWV) at $81.16.
BY Doug Kass · Feb 27, 2026, 10:07 AM EST
BY Doug Kass · Feb 27, 2026, 10:02 AM EST
From my pal Jazzy Jeff Hirsch and The Stock Traders Almanac:
2/26/2026: Dow 49499.20 | S&P 6908.86 | NASDAQ 22878.38 | Russell 2K 2677.29 | NYSE 23524.84 | Value Line Arith 13057.46
Seasonal: Improving. March has historically been a respectable month for DJIA, S&P 500, NASDAQ, and Russell 2000 with average gains ranging from 0.6% from Russell 2000 to 1.0% by S&P 500 in all years. In midterm years, March has generally been even stronger with average gains expanding to 1.1% by DJIA to an impressive 2.5% from Russell 2000. DJIA and S&P 500 have been positive in six of the last seven midterm Marchs.
Fundamental: Mixed. After a messy Q4 forecast due to the Federal government shutdown, the Atlanta Fed’s GDPNow model currently estimates Q1 growth at 3.1%. Inflation continues to run at a stubbornly elevated level but did hint at some degree of cooling with consumer prices (CPI) coming in below expectations in January at 2.4% year-over-year. Nonfarm employment was also better than anticipated in January with 130,000 job gains. All reasonably fair numbers yet room for improvement remains. Corporate earnings were generally better than expected, but that result has essentially become the norm leaving traders and investors generally wanting for more.
Technical: Rotation. DJIA closed at new all-time highs, above 50,000 for the first time, in February, but S&P 500, NASDAQ, and Russell 2000 did not. DJIA did close below its 50-day moving average once this month while NASDAQ spent most of the month below its 50-day moving average. Money has moved out of technology but not completely out of the market. Key levels to watch are December’s closing lows for DJIA and S&P 500 at 47289 and 6721 respectively. For NASDAQ, its November closing low at 22078.
Monetary: 3.50 – 3.75%. Based upon the CME Group’s FedWatch Tool, the Fed is not likely to make any changes to interest rates until sometime later in the second half of the year with just a 67.4% chance for a rate reduction in July. It seems reasonable to believe that this tool is also taking into consideration a change of leadership at the Fed as well. If this is the case, the Fed and its board members will likely remain busy giving speeches and media interviews as they continue to await new economic data. This lack of a unified message from the Fed likely does more harm than good.
Sentiment: Elevated. According to Investor’s Intelligence Advisors Sentiment survey Bullish advisors stand at 55.6%. Correction advisors are at 29.6% and Bearish advisors were just 14.8% as of their February 25 release. Compared to last month, overall sentiment has eased slightly. Some bullish advisors have shifted to correction, but outright bearish advisors remain subdued. Based upon sentiment, caution is still in order. Stick with sectors and/or stocks that have been working while avoiding highly speculative areas that have been struggling lately.
---------------------------------------------------------------
Last month we warned you about the market’s propensity to take a break in February, especially after a run-up like we had and a positive January. February played out rather close to its history as the weak link in the “Best Six Month” and delivered typical choppy market action. S&P 500, NASDAQ and Russell 1000 remain in the red for the month at today’s close while DJIA and Russell 2000 are positive with the small cap benchmark in the lead, up 2.4%.
Seasonal softness, elevated volatility, and lost momentum near the top of the current trading range do not necessarily indicate a structural breakdown. There does not appear to be any major reason for this pullback. This seems like a classic combination of market consolidation, typical midterm election year seasonal weakness and some sector rotation. Beneath the surface, technical support remains intact, seasonal patterns remain aligned with expectations, and economic fundamentals—particularly jobless claims—continue to signal resilience. Today’s initial jobless claims number was lower than estimates and remains historically supportive, even as headlines continue to lean negative.
We’ve covered significant ground off last year’s lows, and it’s natural to see some toppy behavior in leading indexes. Some technicians are noting Hindenburg omens and other cautionary signals floating around. But we’ve heard these false alarms before. Nothing in our observations suggests a major breakdown—rather, a market nearing the ceiling of its recent range and preparing for the next rotation.
Our seasonal charts continue to indicate the potential for additional upside into the end of the Best Six Months, though gains from here are likely to be modest. Notice in the updated S&P 500 Midterm Election Year Seasonal Pattern chart how the market begins to flatten out around the Ides of March (mid-month) in the midterm year. This is a good reminder that we are approaching the window where the market often settles into the classic midterm election year Q2-Q3 weak spot.

Elevated Sentiment Concerns
Our favorite sentiment indicator has now become concerning. The difference between Investors Intelligence Bullish Advisors % less Bearish Advisors % has been elevated for some time now. The bull-bear spread tracked in the chart below has been above +40 six times in the last seven weeks and it’s the second push above this danger zone level in the past four months. As you can see in the yellow shades it was last at these levels in October/November 2025.
This looks like the pattern we traced out in 2024 ahead of the early 2025 tariff-induced correction. We are not anticipating as severe a correction as the tariff tumble but highlighting that a third push above +40 bulls is likely to lead to a more sustained pullback, which would align well with our seasonal “Worst Six Months” May-October and the Midterm Year Q2-Q3 Weak Spot.

Technical Levels to Watch
Our outlook for the full year remains bullish with our base case scenario of 8-12% annual gains on track. The positive January Barometer reading has affirmed our bullish stance. And while the January Barometer rules, there are some technical levels we are watching. Number one is the Dow’s December Closing Low indicator (page 36 STA 2026), which we detailed in the February Outlook. The December Low Indicator is based on the Dow closing below its December Closing Low in the first quarter of the New Year. DJIA’s December closing low was 47289.33 on 12/1/2025. DJIA is currently 2210 points higher than that level today. But it is still a line in the sand to watch.
As you can see from the chart below, this December low level also lines up with support for the S&P 500 in the black line around 6700. Near term support sits at about 6800 as indicated in the short horizontal blue line right at the February 5 low which has encouragingly held so far this month with one day to go. Should we break this 6700-6800 support area the next level of support sits at about 6500 near the October and November lows and the late August/early September consolidation area. Below that is 6200 around the end-of-July/first day-of August four-day correction and the bottom of the early July consolidation. Below that is the 6000 area near the June gap higher, but that is unlikely at this juncture.
Sentiment remains elevated, momentum is slowing, and we are increasingly seeing a sideways range develop. This transition is right on seasonal schedule. Any number of catalysts can trigger the soft patch: more AI disruptions, tariff and trade tensions, geopolitical flare-ups, shifting Fed and interest rate expectations and midterm election-year politicking. Whatever the case, the market environment is clearly ripening for some seasonal weakness. After one more push higher to perhaps marginal new highs the market is likely to begin a more sustained pullback and move sideways from mid-March through the end of April. Stick with the data, lean on seasonality, and avoid overreacting to short-term narratives and tune out the negative noise.
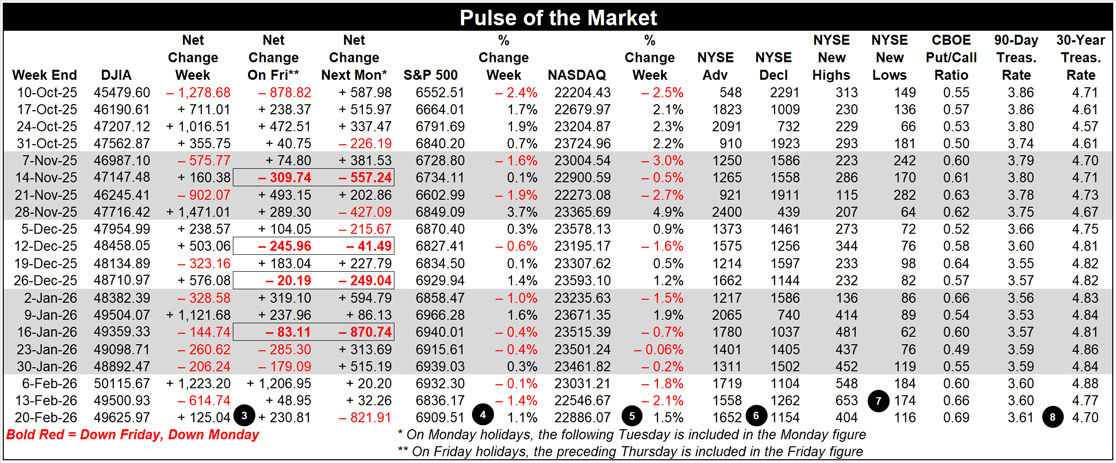
Pulse of the Market
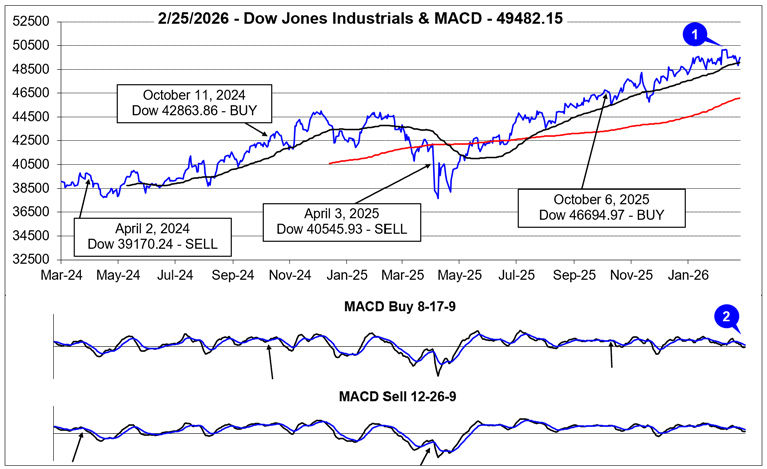
Although it may feel like it has been a painfully long time since everyone was last talking about new all-time closing highs, it will be just three weeks since DJIA first closed above 50,000 on Friday, February 6. DJIA went on to close above this key psychological level three additional days in a row (1) before succumbing to the drag of AI everything concerns. Nonetheless, DJIA has proven its resilience, holding onto a 1.2% February gain. With one trading day left in February it is on the verge of extending its historic monthly winning streak to 10 in a row.
DJIA’s loss of positive momentum around mid-February is confirmed by both the faster and slower moving MACD indicators being negative and trending lower (2) as of the close on February 25. Bullishly, DJIA’s dip below its 50-day moving average was limited with just a single close below and its uptrend from last spring still remains intact.
For all the chop and volatility, the market has been exhibiting, trader and investor sentiment appears to be holding up. Aside from the single Down Friday/Down Monday (DF/DM) occurrence in January and three modest DJIA weekly declines (3) performance on Fridays and Mondays (or first trading day of the week) has not been overly negative. If traders and investors are comfortable enough to hold positions over the weekend and then buy again on Mondays, it would seem expectations for additional gains are still holding up. Should market performance significantly deteriorate on Fridays and/or Mondays, this could be a sign that market expectations are shifting negatively.
Given all the red weekly losses for DJIA (3), S&P 500 (4), and NASDAQ (5) since the start of 2026, it may come as a surprise that only NASDAQ is down year-to-date as of today’s close (February 26). Also of note is NASDAQ’s five week losing streak that ended last week on February 20, was its longest consecutive weekly losing streak since May of 2022 when it was down seven straight and 10 out of 11. Cumulative losses during this year’s weekly losing streak have been relatively mild compared to similar past streaks. This would appear to suggest rotation and repositioning rather than an outright exit.
Market breadth over the last three weeks has been positive with Weekly Advancers outnumbering Weekly Decliners (6) despite S&P 500 and NASDAQ weekly declines in two of the three weeks. This also appears bullish and supportive of a rotation/reposition theme rather than broad-based selling. Technology shares have had an impressive run and some of those profits appear to be moving to other potentially more attractive corners of the market.
Another positive and bullish indication is that the number of new 52-week Highs (7) hit a high of 653 during the week ending February 13. However, new 52-week Lows also briefly expanded before declining in each of the last two weeks. This also appears to support a rotation theme rather than an outright exit. A steady trend higher in the number of new 52-week Highs accompanied by an opposite trajectory for new 52-week Lows would be ideal. Any meaningful deviation from the ideal scenario would warrant additional caution especially as the “Weak Spot” of the 4-Year Presidential Election Cycle draws near (page 46 of STA 2026).
Short-term and long-term Treasury bond yields appear to be settling into a range (8) now that Fed interest rate cuts appear to be on hold for the near-term. Lingering disruptions due to last fall’s Federal government shutdown are also likely weighing on rates as economic data has become increasingly mixed recently. Rate stability combined with relatively low rates has historically benefited the stock market. Any dramatic change in interest rates would likely be disruptive no matter if it was lower or higher.

On March 11 Jeff is joining Fausto Pugliese’s Cyber Trading University with a host of other top traders for March’s Cyber Expo Trading Summit for two intensive days of cutting-edge strategies, market analysis, and tools to help you trade. March 11-12 | Live Online – Reserve Your Free Spot Here: https://cybertradingexpo.com/march-2026-traders-almanac
Then in April he will be presenting at The 2026 MoneyShow Masters Symposium Hollywood Florida which will run from April 9-11 at the exclusive Diplomat Beach Resort. Over three days at the oceanfront venue, you’ll learn about the greatest investing and trading opportunities in 2026 – from dozens of the nation’s leading financial experts.
Here are my two sessions at the Expo on Thursday, April 9, 2026:
Should you Sell in May in the Midterm Election Year 2026?
Stock Panel: The NEW Leaders: A Case for Small Caps, Out-of-Favor Sectors, and “Forgotten” Stocks
For more details and to claim your pass to the 2026 MoneyShow Masters Symposium in Hollywood, Florida click here! https://hollywoodfloridamms.moneyshow.com/?scode=066768
BY Doug Kass · Feb 27, 2026, 10:00 AM EST
I covered yesterday's (GRNY) short at $24.80.
BY Doug Kass · Feb 27, 2026, 9:49 AM EST
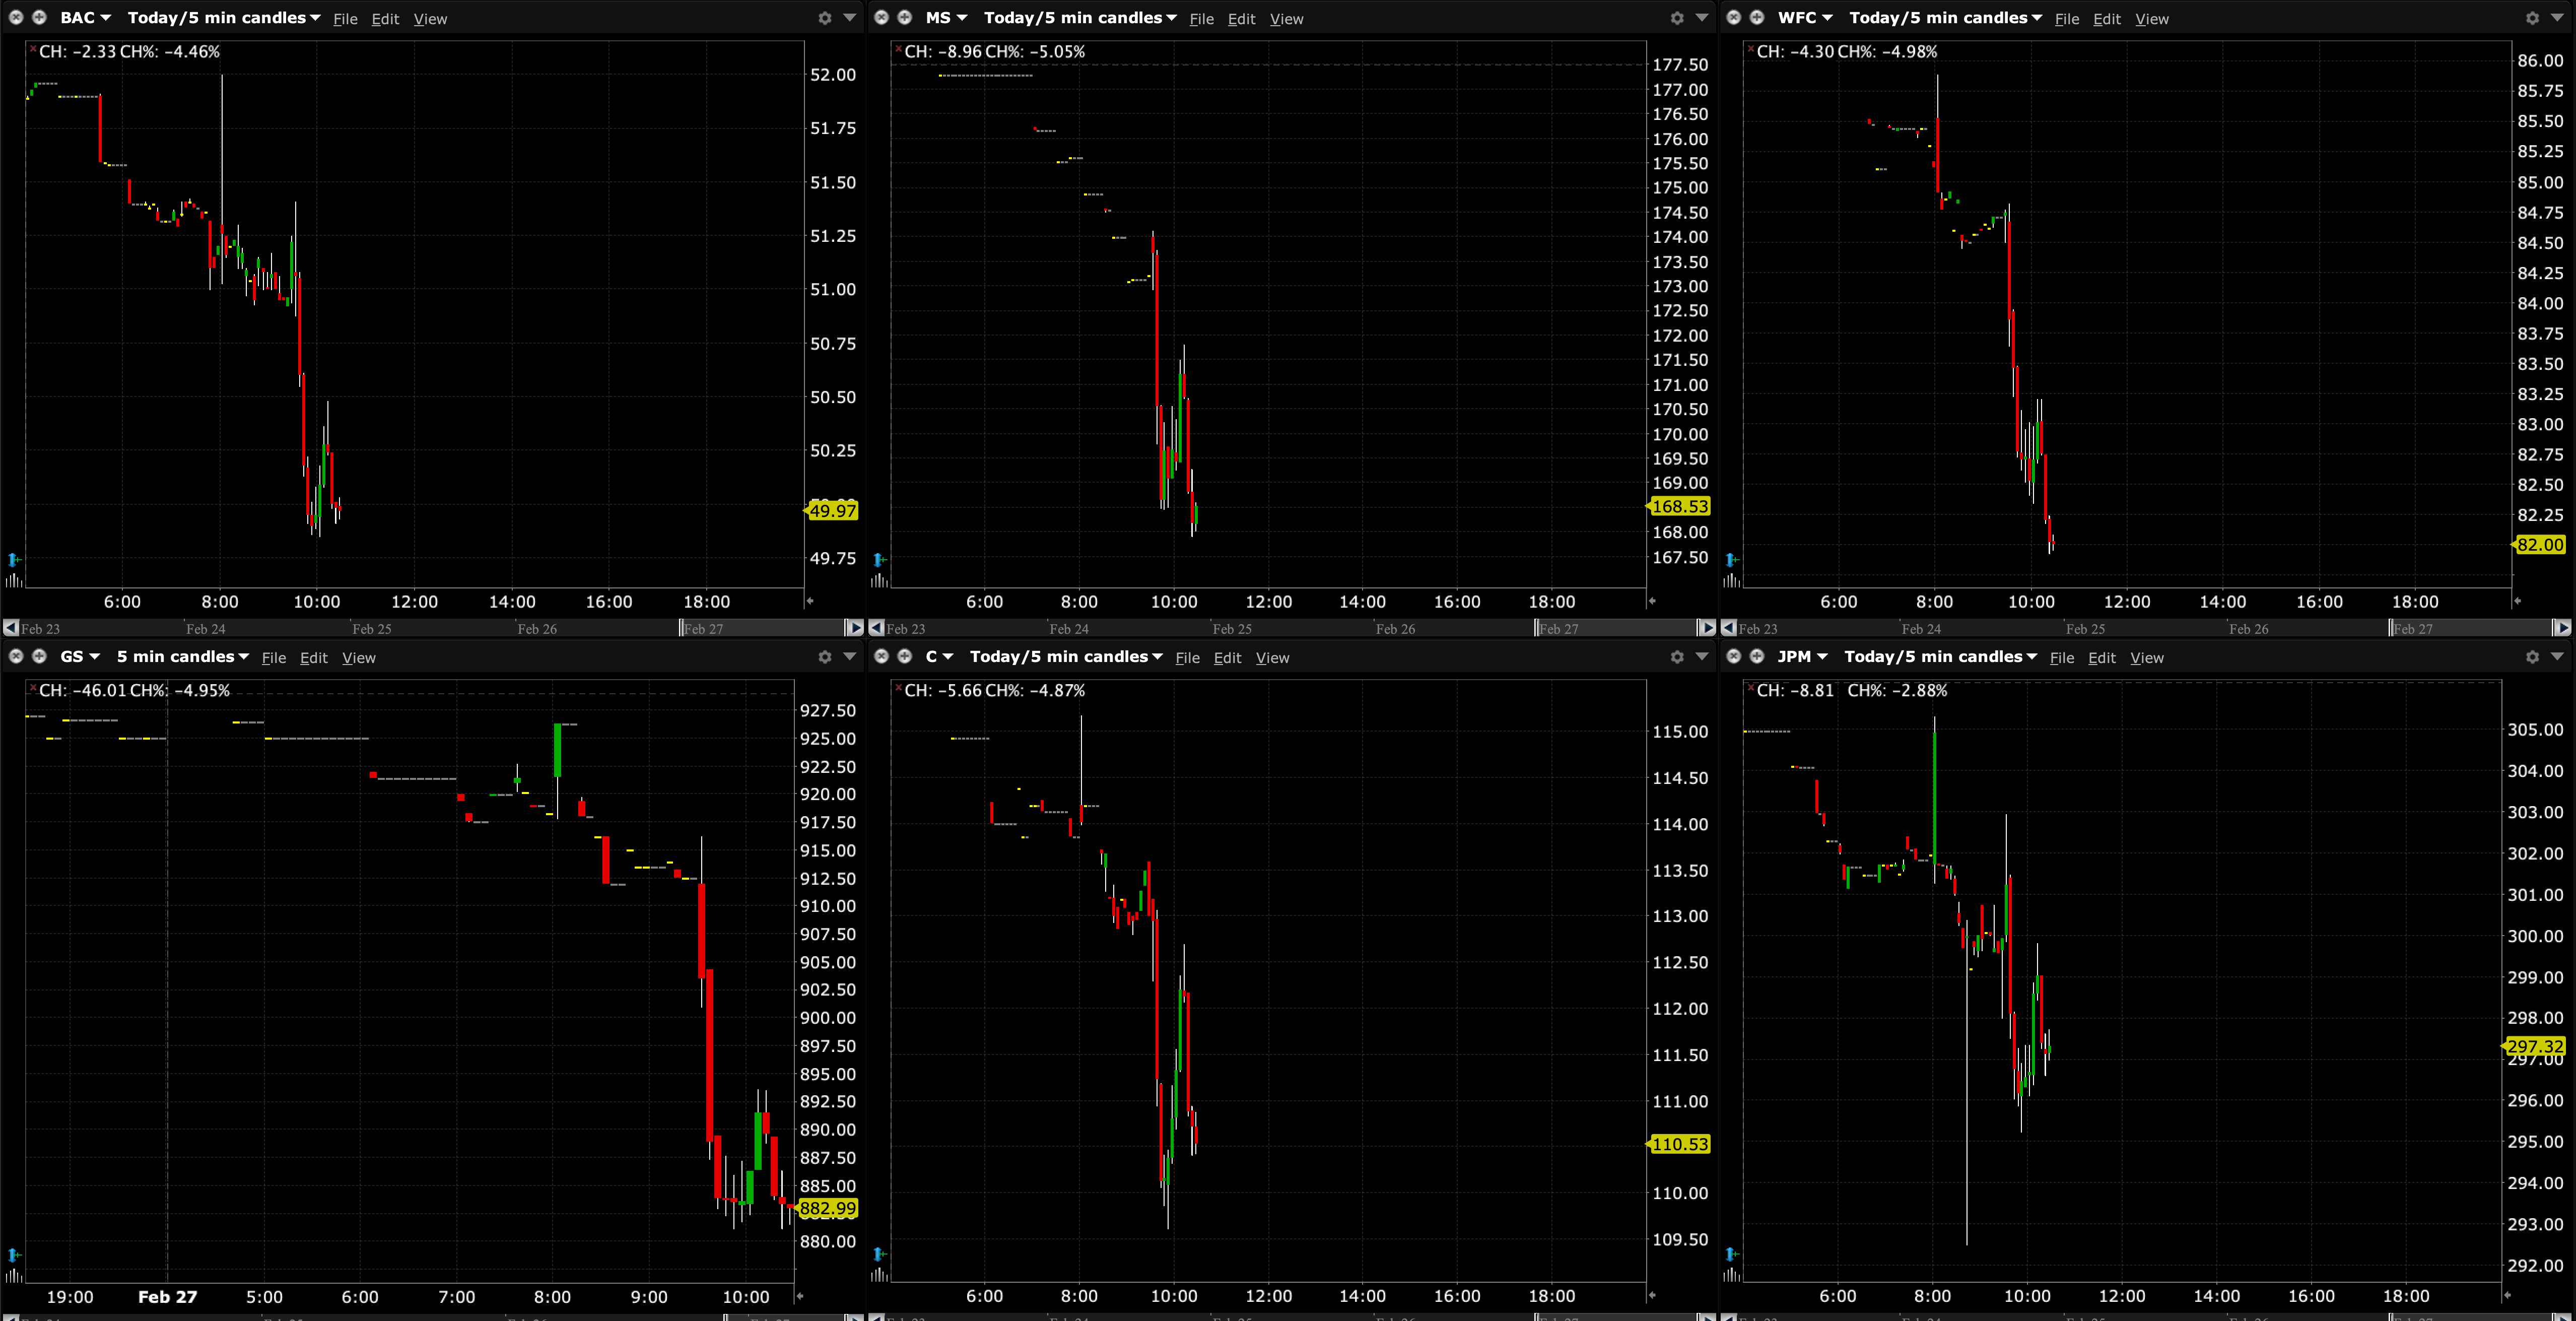
Carnage in financials ... in the market without memory from day to day.
BY Doug Kass · Feb 27, 2026, 9:45 AM EST
-KORE +80% (to be acquired at $9.25/shr by Searchlight Capital Partners and Abry Partners)
-XYZ +19% (cuts workforce by 40%; earnings, guidance)
-PRAA +18% (earnings)
-AAOI +17% (earnings, guidance; files to sell up to $250M of common stock)
-NGNE +17% (US FDA grants Breakthrough Therapy Designation for NGN-401 Gene Therapy for Rett Syndrome)
-ARLO +16% (earnings, guidance)
-FIGS +16% (earnings, guidance)
-DELL +15% (earnings, guidance)
-CAI +14% (earnings, guidance)
-MARA +12% (earnings)
-NATL +12% (Brink's (BCO) to acquire NCR Atleos for $6.6B in $30/shr in cash and 0.1574 shares/shr ; earnings, guidance)
-REAL +12% (earnings, guidance)
-PUBM +11% (earnings, guidance)
-NFLX +8.0% (PSKY wins battle for WBD bid)
-PSKY +6.7% (PSKY wins battle for WBD bid)
-STRZ +4.2% (earnings, color)
-DUOL -26% (earnings, guidance; authorizes share repurchase)
-EBS -22% (earnings, guidance)
-DNA -19% (earnings)
-FLUT -13% (earnings, guidance)
-AMBA -12% (earnings, guidance)
-CRI -12% (earnings, guidance)
-CRWV -12% (earnings, guidance)
-SG -12% (earnings, guidance)
-ZS -12% (earnings, guidance)
-FLGT -9.2% (earnings, guidance)
-BCO -8.8% (to acquire NCR Atleos for $6.6B in $30/shr in cash; earnings, guidance)
-KTOS -8.3% (prices ~14.3M shares at $84.00/shr for gross proceeds ~$1.2B)
-LASR -7.9% (earnings, guidance)
-RKLB -6.2% (earnings, guidance)
-SMR -5.3% (earnings, guidance)
-GSAT -3.4% (earnings, guidance)
-INTU -3.4% (earnings, guidance)
-MP -2.5% (earnings, color)
-MSFT -2.4% (hearing UBS Cuts US Tech Sector to Neutral)
-DLTR -2.3% (CitiGroup Cuts DLTR to Neutral from Buy, price target: $132)
BY Doug Kass · Feb 27, 2026, 9:15 AM EST
From Peter Boockvar:
Yesterday’s initial jobless claims data remained low with a print of 212k and a 4 week average of 220k. Each time I give a bottom line when going over the weekly figures I typically say that the pace of firing’s ‘as measured here’ remain low. I say that because there is an argument to be made that people that lose their jobs are not filing for benefits and instead are taking gig type jobs because more money could be made doing so when compared with the unemployment benefits. My good friend Danielle Dimartino Booth put out a poll on X yesterday asking the question addressing this.
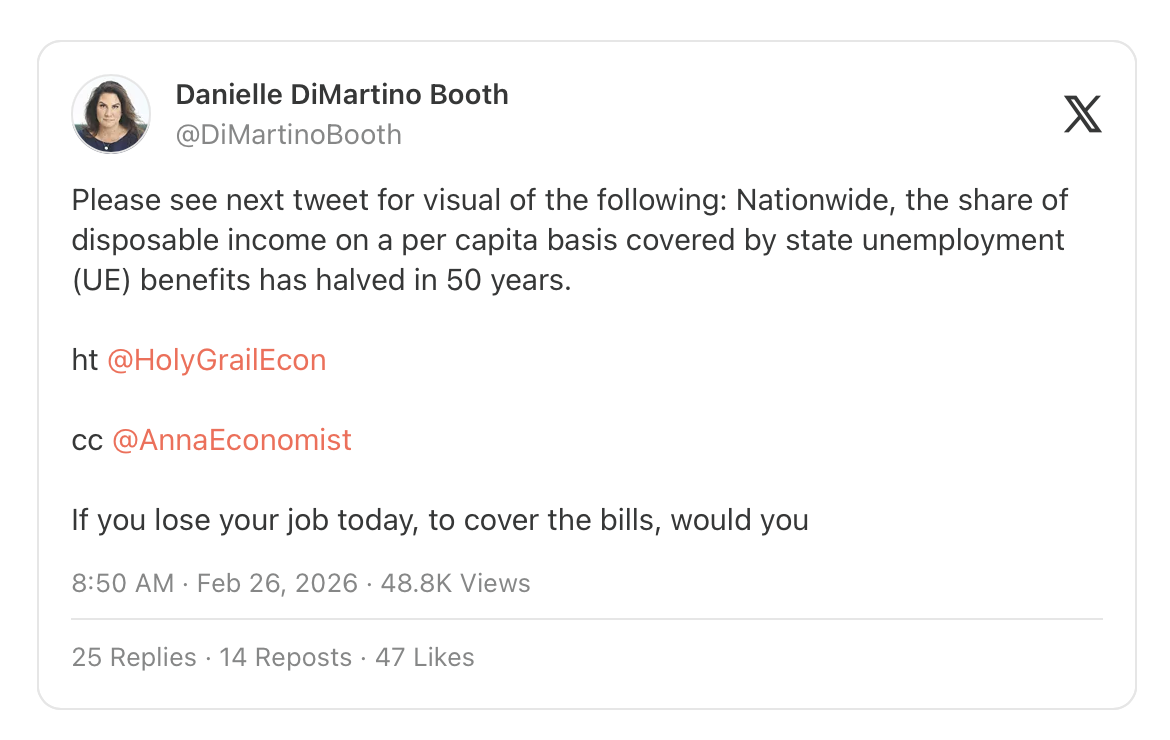
For those that can’t open it, the question was “If you lose your job today, to cover the bills, would you”:
Apply for UE benefits 55%
Pick up ride/delivery gig 45%
The US 10 yr yield is dipping below 4% to the lowest since October and down about 30 bps from a month ago. What’s it telling us? Over the past month the 10 yr inflation breakeven is lower by 8 bps to 2.29% so some of this due to economic worries. I do want to point out that the growing focus and selloff in private credit and leveraged loans has begun to slightly creep in to the high yield market. The Bloomberg High Yield spread has ticked up to 284 bps, still very low I want to highlight but quietly matching the highest level since late November.
In case you didn’t see yesterday, FS KKR Capital Corp, a publicly traded BDC, fell 15% after they cut their dividend and trimmed their NAV by 5%. On their call, they said this of note:
“we experienced downward pressure on a few specific investments across our portfolio, which resulted in a decline in our net asset value. We acknowledge that non-investment grade private debt investing necessarily will result in underperforming assets from time to time. However, we are disappointed by these markdowns.”
“Looking ahead to 2026...we expect to address underperforming assets through restructurings, exits, and continued proactive portfolio monitoring to reduce the number of non-accruals and non-income producing investments in the portfolio.”
Midcap Financial Investment, a BDC sponsored by Apollo, fell 4% yesterday after they also lowered its NAV and trimmed its dividend.
They were still optimistic on the health of their loan book. “The overall portfolio continues to show resilience as evidenced by our relatively steady credit metrics...With respect to software, our exposure is meaningfully lower than the broader BDC industry. As of December 31, 2025, software represented only 11.4% of MFIC’s portfolio at fair value. We have contructed a portfolio that we believe is relatively resilient to AI related risks, with an emphasis on businesses that have long standing, entrenched customer relationships.”
From Papa John’s, which fell 9% yesterday because of a down 2-4% comp guidance:
“from a consumer lens, in the fourth quarter, we saw strength in our loyalty customers and existing customers in North America. However, new customer acquisition was lower than last year, which pressured comparable sales. From a product perspective, core pizza remains resilient. We continue to see consumers buying more pizzas overall with the total number of pizzas sold actually increasing 1%, as well as improvement in orders that included multiple pizzas.”
“On the other hand, single pie orders declined during the quarter and total pizza sales declined low single digits as our order mix shifted towards smaller non-specialty pizzas.”
“North America comparable sales decreased 5% in the fourth quarter, driven by a 5.5% decrease in transaction comps across our restaurants. Carryout grew 1%, but was more than offset by declines in total delivery.”
Off the lowest level since the Covid shutdown in March 2020, Bloomin’ Brands rallied 8% yesterday. The owner of Outback Steakhouse, Carrabba’s Italian Grill, Bonefish Grill and Fleming’s Steakhouse said this of note:
“Our Q4 comps were flat with US traffic up 50 bps. Although we trailed the industry as defined as BlackBox by 40 bps on comp sales, we narrowed the gap versus the industry by 280 bps q/o/q.”
“All of our casual dine in brands executed affordable entry prices to meet the guests where they were economically.”
Outback in particular saw the first positive comp since Q4 ‘21 as they provide pretty affordable options for diners with “an entry price point of $14.99” and they “continue to see about 60% of the guests trading up to the higher tiers of $17.99 and $20.99.”
They saw commodity inflation of 4.7% mostly because of higher beef prices and labor inflation of 3.2%. In fiscal ‘26 they expect commodity inflation between 4.5% and 5.5%, “driven in large part by beef inflation of high single digits.” Labor inflation is expected to remain in the 3% to 3.5% range.
On the cadence of their business, “The first half of the quarter, we saw some strong trends, but in the back half, consistent with the industry, predominantly the last six weeks of the quarter, we did see a noticeable step down in traffic. To Q1, we saw a very strong start to the initial part of 2026 until we started dealing with some pretty extreme weather. I will point out Valentine’s weekend, Valentine’s week was very strong in terms of sales and profits.”
From Shake Shack that rallied 7% on a comp gain of 2.3% in the quarter and good comp guidance for Q1:
“I would like to give some color on our strong start to the year. January’s same Shack sales grew 4.3% y/o/y. Despite meaningful weather headwinds in January, we’ve nevertheless generated solid sales growth fueled by continued traction in our in-app value platform, increased hours of operations in our Shacks, and the launch of compelling culinary innovation.”
“In-Shack menu prices rose about 2%, while blended pricing across all channels increased approximately 4%. This compares to approximately 6% last year, demonstrating our ability to deliver positive same Shack sales with less dependence on price increases.”
Their beef costs were up low teens. With guidance, “Our inflation outlook reflects our expectations for low single digit inflation with commodity pressure from beef up mid teens partially offset by supply chain savings initiatives.”
On pricing, “our overall price across all channels will be up approximately 3%.”
Sports and live entertainment continue to hold a special place in the global economy. Liberty Formula Onefell 3% but after rising by 2.4% Wednesday and said this:
“F1 once again delivered an exceptional year with the sport firing on all cylinders across growth, engagement, and commercial momentum. We renewed with multiple long term existing partners and signed several new marketing partners.”
“Cumulative viewship is up across our broadcast and digital platforms. Global live TV viewship across all sessions was up plus 21% y/o/y, showing increased appeal for our core product.”
Warby Parker popped by 18% yesterday, helped by the possibility of a pick up in sales soon with them selling Google glasses. From them:
“This year, we also plan to introduce our first AI glasses in partnership with Google and Samsung, which we expect will unlock significant new TAM and enable us to take advantage of the biggest technology shift in our lifetime. These devices will bring the world’s most advanced AI to glasses designed for all day wear.”
“While the core eyewear category remains large and more stable than most consumer sectors, we have seen more volatility in demand and transient softness than usual in the post pandemic era, including during some periods over the last year. Our confidence remains in the long term durability and attractiveness of the category, given the increasing health need that it serves, but we are planning conservatively for the near term, given recent trends.”
“As we shared on our last call, our guidance assumed that the trends we saw in September and October would continue through the end of the year. However in December, we saw a slowdown in our one year and two year growth trends, with softness concentrated in our 25-34 year old consumer cohort, while our older progressive customer remained more resilient. We experienced softer retail traffic and contact lens growth slowed, which pressured our e-commerce channel. As a result of this, fourth quarter adjusted EBITDA came in below our expectations.”
Dell Technologies is jumping by 10% and said this:
“The AI opportunity is meaningfully growing and transforming the company...In Q4, we booked $34.1 billion in AI orders, evidenced that demand is accelerating as customers deploy AI at scale.”
“Moving to traditional servers. Demand significantly outpaced supply in Q4 with strong double digit demand growth across every region and momentum accelerated through the quarter as customers prioritized access to compute for critical workloads.”
“We are gaining share in our PC business and strengthening ISG (infrastructure solutions group) with strong margins in traditional servers and storage, all while positioning the company for the AI era.”
In its PC business, in response to rising component/memory costs, “We implemented pricing moves effective January 6 to reflect our higher input costs.”
While Dell’s AI server business is robust for now, I’m sure CoreWeave is one of their customers and that stock is tumbling by 11% because of huge spend (which in turn benefits Dell for now) and still reporting losses.
The top line is still growing fast, “CoreWeave is the fastest cloud in history to reach $5 billion in annual revenue. We remain in the early stages of the most transformative infrastructure build-out in history and CoreWeave is at the forefront, building and operating some of the largest purpose built AI clusters for the world’s most demanding workloads.”
“Regarding demand, the signals we are seeing across hyperscalers, AI natives and enterprise customers are only intensifying as AI workloads get more complex, models scale faster and adoption continues to proliferate.”
But what is worrying investors today, “We expect 2026 CapEx of $30 billion to $35 billion, which is more than double our 2025 investment. Substantially all of it is tied to our already signed customer contracts that we intend to bring online this year as we expect to double our active power capaicty to more than 1.7 GW by year end.”
“As I have described previously, when new capacity comes into service, data center lease costs, including power and depreciation expense commence, while customer revenue ramps over subsequent months...We will be bringing online roughly double the capacity of 2025, which means a corresponding increase in depreciation running ahead of associated revenue recognition.”
Overseas, JGB yields are down but the CPI February figure for Tokyo rose 2.5% ex food and energy, above the estimate of 2.3%. With PM Takaichi wanting low rates and the continued pressure on the yen, still high inflation and longer term interest rates, the BoJ is in a really tough spot.
In France, February CPI moved up to 1.1% y/o/y from up .4% in January and that was above the estimate of up .8%. Germany reports its CPI today too. Germany also reported its February jobs data that was about as expected.
In Spain, its CPI rose 2.5% y/o/y, above the estimate of 2.3%. The ECB is on hold for a while with its deposit rate at 2%.
BY Doug Kass · Feb 27, 2026, 9:05 AM EST
BY Doug Kass · Feb 27, 2026, 8:45 AM EST

BY Doug Kass · Feb 27, 2026, 8:30 AM EST
BY Doug Kass · Feb 27, 2026, 8:19 AM EST
Oaktree's Howard Marks latest commentary:
BY Doug Kass · Feb 27, 2026, 7:55 AM EST
BY Doug Kass · Feb 27, 2026, 7:45 AM EST
BY Doug Kass · Feb 27, 2026, 7:35 AM EST
BY Doug Kass · Feb 27, 2026, 7:25 AM EST
We re-shorted CoreWeave (CRWV) yesterday — in premarket the shares are -$12:
BY Doug Kass · Feb 27, 2026, 7:15 AM EST
The tweet below about Block (XYZ) laying off about half its employees due to “AI” is exactly right, in my view.
In my opinion, Block’s statements about the layoffs could be construed as materially misleading as well:
This is not how layoffs due to a new technology work. If this were true, it would start at first with pilot projects and be reflected in its early stages by slowing headcount growth, then flattening, then slow attrition, followed by smaller buckets of layoffs over time. NOT a step function out of nowhere, where half of the employees are fired all of the sudden, with little to no detail about what exactly is in place right now to replace everything they were doing.
Not how it works.
In my view, these layoffs are happening because Block is a mature company, with no revenue growth (in the just reported Q, revenue grew at about 3.5% Y-Y).
This is one more Jack Dorsey venture. He is seemingly a guy who has made a lot of money but has no idea how to run businesses.
Whatever one thinks of Elon Musk, at least he knows how to run a business. That is why Space X ran circles around NASA and Boeing (BA) , and whoever else was building overpriced rockets. Musk was able to reduce headcount at Twitter from about 8,000 employees, to 1,500 employees almost overnight, and nothing changed there with regard to how the business functioned at a bricks and mortar level. It was just full of bloat, that was cut out. Musk did this long before anyone had heard anything about AI.
It was all just Jack Dorsey bloat. It does not take AI to fire “employees” who are sitting around and doing nothing but whine.
But expect to hear more of this from either businesses in similar positions or bigger companies with business units in similar position, where the parent company ( (MSFT) for example) has a vested interest in AI. Employees will be laid off for normal business reasons and the company laying the people off, rather than admitting business sucks, or they have a broken business model, or there is no growth, or they are burning too much cash on overhead, will just turn around and say “we are laying off these employees due to AI.”
It is just a bunch of baloney. The Block thing is obvious, in my view. It is just Twitter, pre Musk.
A big pile of Jack Dorsey bloat.
BY Doug Kass · Feb 27, 2026, 6:25 AM EST
In The Times of Israel, Huckabee warns that embassy staff members who want to leave Israel should "do so today."
BY Doug Kass · Feb 27, 2026, 6:05 AM EST
We re-shorted CoreWeave (CRWV) yesterday:
Here are Thursday's things:
* Covered (SPY) short calls on whoosh lower.
* Re-shorted (GRNY) at $25.05.
BY Doug Kass · Feb 27, 2026, 5:55 AM EST
The S&P Short Range Oscillator remains slightly overbought at 1.40% vs. 1.01%.
BY Doug Kass · Feb 27, 2026, 5:45 AM EST