Train Hundred and Two Is on the Wrong Track and Headed for You
* Look out below — investors are meaningfully underpricing risk.
* "Slugflation" remains our base case — accompanied by a revaluation (lower) in price earnings multiples.
* The Fed may be between a rock and a hard place.
* More aggressive money printing (encouraged by President Trump) could cushion the market downside over the short term but could contribute to more downside "down the road."
* We think the downside risk is approximately 4x the upside reward...
Driving that train High on cocaine Casey Jones you better Watch your speed Trouble ahead Trouble behind And you know that notion Just crossed my mind
Trouble ahead A lady in red Take my advice You'd be better off dead Switchman sleeping Train hundred and two is On the wrong track And headed for you
That said, for the moment, I clearly continue to underestimate the markets' strength and my ursine market view (which is in the distinct minority) has been wrong-footed. (As Grandma Koufax used to tell me, "Dougie, If you want to be trusted, be honest!)
I invest unemotionally, refusing to compromise our dual mandate of assessing of reward v. risk and "margin of safety" even as many market participants seem to be losing their heads.
Investors continue to disregard the worsening fundamentals (slowing economic growth and sticky inflation), threatening geopolitics (China is building their own axis of power with Russia and India at a time in which the U.S. technology complex remains highly dependent on inputs from China), the most polarized and uncooperative Democratic/Republican parties in history, an unbalanced domestic economy (of haves and have nots), reckless fiscal policy that has contributed to a never ending expansion of the U.S. debt load and historically elevated valuations.
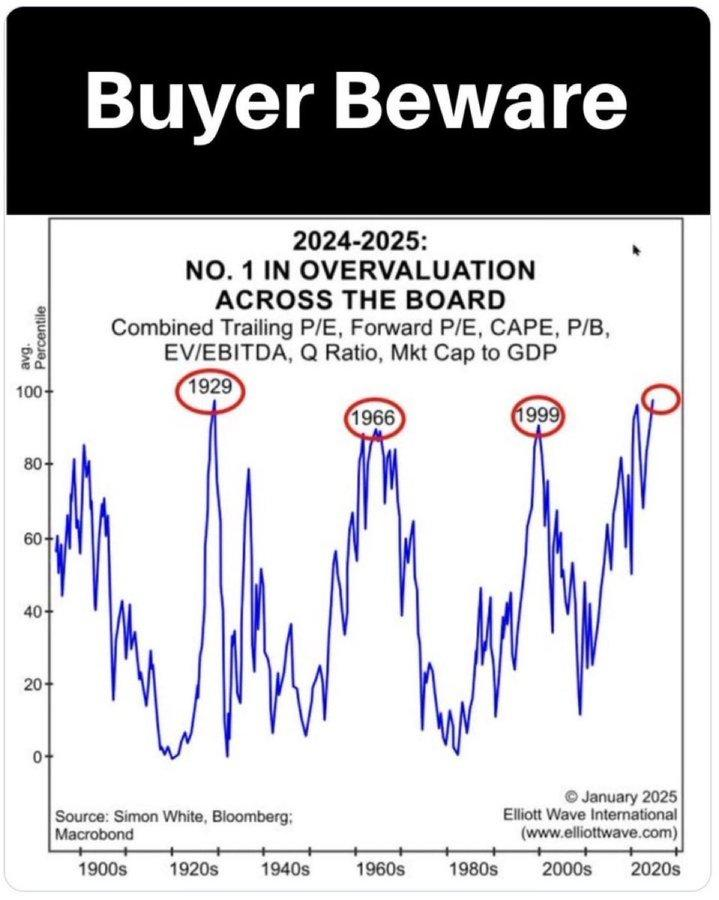
Valuations Are at an Historical Extreme
As I have expressed over the last few months, I feel strongly that stocks represent little value today. I am increasingly confident that equities will likely decline from current levels.
I am equally confident that I will be willing to expand my long exposure at the appropriate time when equities, again, represent a better value proposition.
Bubble, Bubble Toil and Trouble?
In the business media, comparisons today are being increasingly made with prior bubbles. I wanted to offer my views of this subject.
There have arguably been three well-defined speculative cycles in equities over the last six decades — The Nifty Fifty Era (the 1960s to the early 1970s), the Dot-Com Boom (mid-to-late 1990s to early 2000) and the recent Mag 7 and AI Boom.
All three of these eras have fueled a bull market in equities. The end of the Nifty Fifty Era and the Dot-Com Boom marked the end of the respective bull markets and were followed by market crashes.
* The Nifty Fifty Era was marked by fifty large cap stocks that were considered blue chips and buy and hold (one decision) growth stocks. The common characteristic of the stocks in this basket was that the companies achieved consistently superior profits growth. They were assigned extraordinarily high price/earnings ratios of 50x or higher — well above the long-term market average of between 15x and 20x. Representative stocks included American Express, Avon Products, Bristol-Myers, Coca-Cola, Eastman Kodak, General Electric, Polaroid, Procter & Gamble, Sears, Roebuck and Xerox. Most of the companies on this list were well established, where investors perceived deep moats (preventing competitors from making market share inroads) and with a clear expectation that the companies would sustain high returns on invested capital. The reality was that there was far less innovation taking place in those anointed companies. At the time of The Nifty Fifty, bank trust departments (Citigroup, JPMorgan, etc.) were the dominant investors and materially overweighted these anointed stocks.
* The Dot-Com Boom existed in the late 1990s and peaked in the first quarter of 2000, coincident with the widespread adoption and use of the internet. This technology-inspired boom was seen as similar to others in the past (railroads in the 1840s, automobiles in the early 1900s, radio in the 1920s, television in the 1940s and computer time-sharing in the 1960s and home computers in the 1980s). Webvan, Boo.com and Pets.com were the standard-bearers of that period. In large measure the companies were not real in the sense that they had no plausible business models and they were run by dreamers and not serious businessmen. Essentially, they were one giant promotion. But in size (market capitalizations), the promotions (like Pets.com) were not consequential in market capitalization.
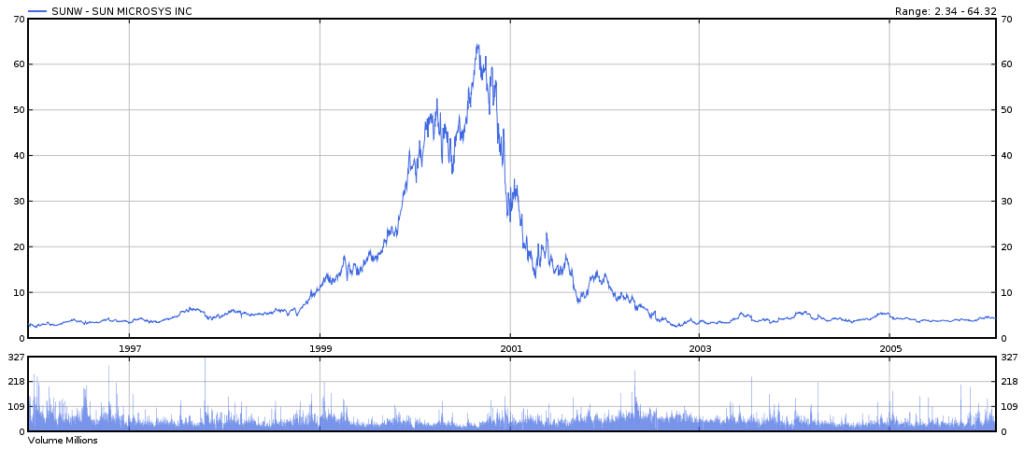
However, several large tech companies (like Cisco and Sun Microsystems) were swept up to ridiculously high valuations along with the worthless dot-com promotions.
Sun Microsystems' market capitalization peaked at over $200 billion — representing a price-to-revenue of (a lofty)10x (which pales when compared to today's tech leaders). Sun Microsystems actually had a suite of revolutionary products from Java programming language to SPARC processors, StarOffice, My SQL, Solaris OS and VirtualBox. The company was ultimately sold for only $7 billion to Oracle a decade after the Dot-Com Boom deflated.
Years after the Dot-Combust Sun Microsystem's Chairman Scott McNealy famously reflected on the absurdity of Sun's peak valuation with this iconic quote:
"At 10 times revenues, to give you a 10-year payback, I have to pay you 100% of revenues for 10 straight years in dividends. That assumes I can get that by my shareholders. That assumes I have zero cost of goods sold, which is very hard for a computer company. That assumes zero expenses, which is really hard with 39,000 employees. That assumes I pay no taxes, which is very hard. And that assumes you pay no taxes on your dividends, which is kind of illegal. And that assumes with zero R&D for the next 10 years, I can maintain the current revenue run rate. Now, having done that, would any of you like to buy my stock at $64? Do you realize how ridiculous those basic assumptions are? You don’t need any transparency. You don’t need any footnotes. What were you thinking?"
Here is a stock chart of Sun Microsystems (1996-2007):
* The (Current) Climb in Mag 7 and AI has fueled almost the entirety of the market advance over the last few years. Unlike the Nifty Fifty or the Dot-Com promotions, Mag 7 consists of companies that historically have had consistently sizeable cash flows, unleveraged and liquid balance sheets and limited (physical plant) capital needs owing to deep competitive moats (and near monopoly status in phones, operating systems, search, etc.). Whereas the industrial Nifty Fifty companies needed to build new factory production lines and new factories to maintain their competitive status and growth, the Mag 7 are able to innovate rapidly and relatively inexpensively by simply sending product upgrades online (with no manufacturing or shipping required).
Until recently the Mag 7 business models were capital light but that has changed with the monumental AI capital spend. Most of the Mag 7 constituents are now becoming capital intensive, which is a big change (and incorporates sizeable risks). This capital outlay is being accompanied by an uncertain timing and level of return on massive and unprecedented amounts of invested capital.
There are some substantial differences between the Dot-Com days and what is going on now with the AI infrastructure build. Capacity put in place in the late 1990s was a very long-lived asset. Take fiber optic cable for example — much of the stuff (and constituent components) put into place then is still in use now. This is one of the reasons why the Dot-Com buildout quickly went into overcapacity. The assets were sticky.
AI infrastructure is the polar opposite. It obsoletes incredibly quickly — much more quickly than depreciation schedules imply. Oddly, this is part of the bull case, ergo everything will keep having to be rapidly replaced, so the spending will not stop. The bull case treats investment capital as infinite and the laws of economics as irrelevant. It assumes the circular financing and money losing will go on forever. Of course, professional investors know that is not true and they do not really believe the grossly dis-economic behavior can continue forever. They just believe it is in place for the quarter we are in (with upbeat guidance) and it is just one more way to rationalize the game of musical chairs they are playing. Most recognize that they are playing the same game and are just being dragged along by the whims of over-levered retail as well. They all think they will be the first to get out when the music stops. Many just don’t care because they manage against a benchmark.
Here are two tweets that demonstrate how dis-economic the AI spend might be:
One other big difference between the Dot-Com days and now, is the Dot-Com stuff actually worked like it was supposed to — it was not a capital black hole. Actually it did increase net productivity, did not consume so much in the way of energy and other resources that it was in fact inflationary. And it was not being subsidized by the public at large (power cost) and actual human content creators.
Bottom Line: I would conclude that the Nifty Fifty Era consisted of a bunch of entrenched companies that were materially overvalued in a period when bank trust departments were the dominant investors. The Dot-Com Boom consisted of a number of promotions and large-cap tech stocks that became significantly overvalued (with day traders becoming the dominant investors). Both could be described as bubbles.
By contrast, the Mag 7/AI period consists of near monopolies (that are arguably fully priced to overpriced) as they morph from capital-light to capital-intensive business models — with the risks associated with circular vendor financing, accessing adequate sources of energy (at a reasonable cost), the availability of capable workers and other potential problems inherent with the construction of large-scale data centers.
While bank trust departments no longer roam the investing planet, passive investing products and strategies (ETFs and quantitative investors) now dominate. Passive investors are unemotional and no nothing about value but everything about price as they all worship at the altar of price momentum — serving to exaggerate the market's returns and that of the leading technology companies.
I conclude that today we are not in a bubble (as we were with the Nifty Fifty and The Dot-Com Boom), though some similarities exist. Rather we are simply in an extremely and historically overvalued market (within a much different market structure backdrop dominated by passive investors).
Finally, here are some examples of comparing valuations in these three eras.
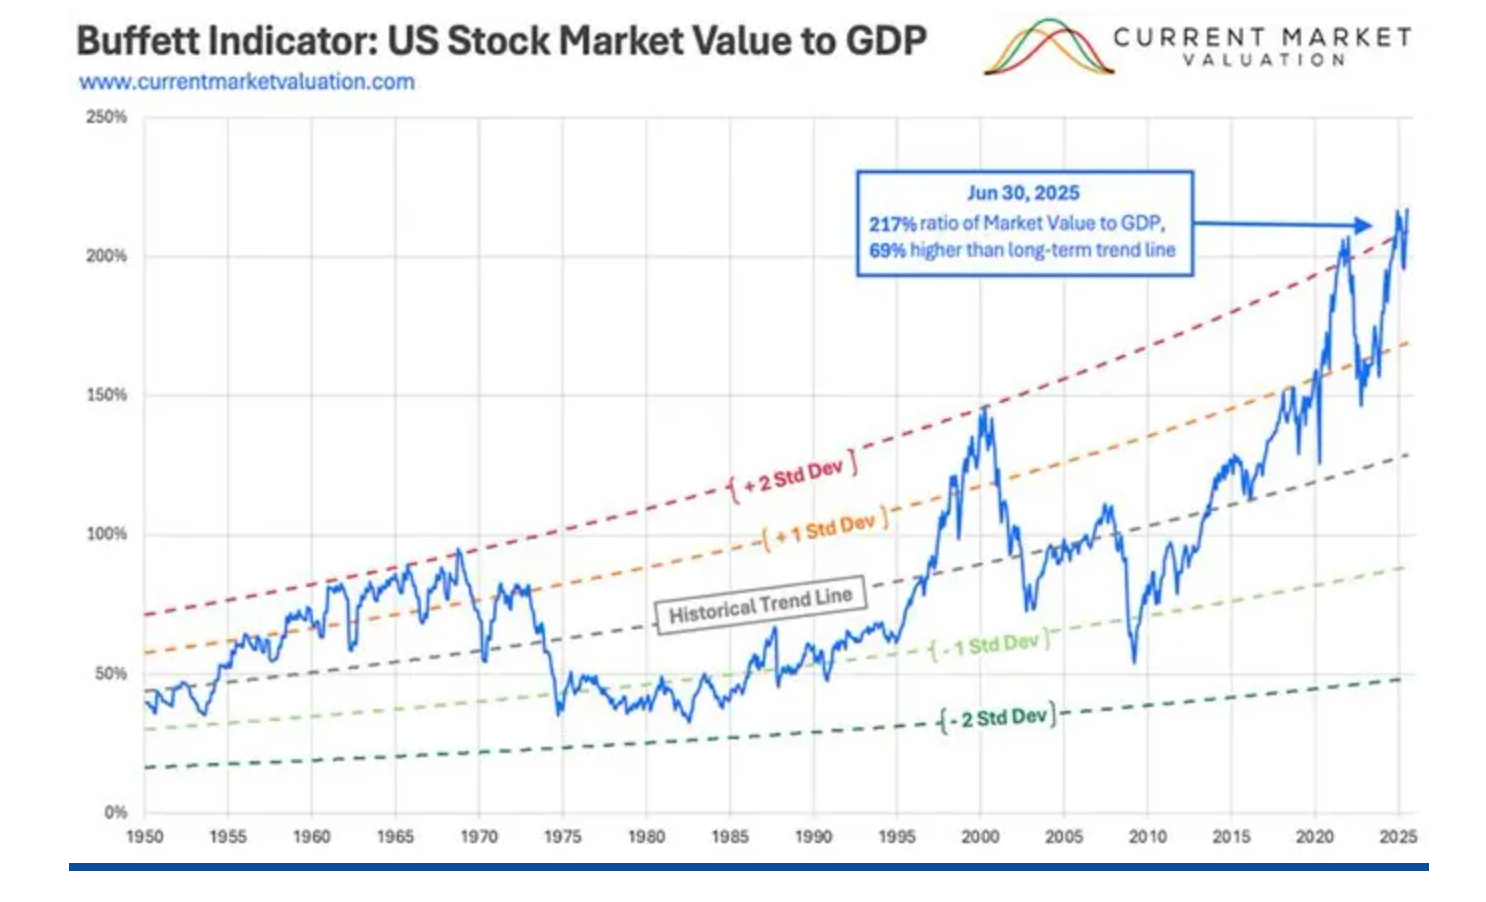
The Buffett Indicator stands at two standard deviations above its long-term trendline and at a record high of 217% (well above the Dot-Com era):
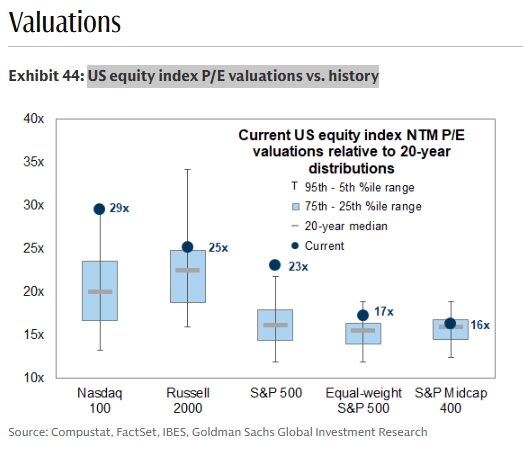
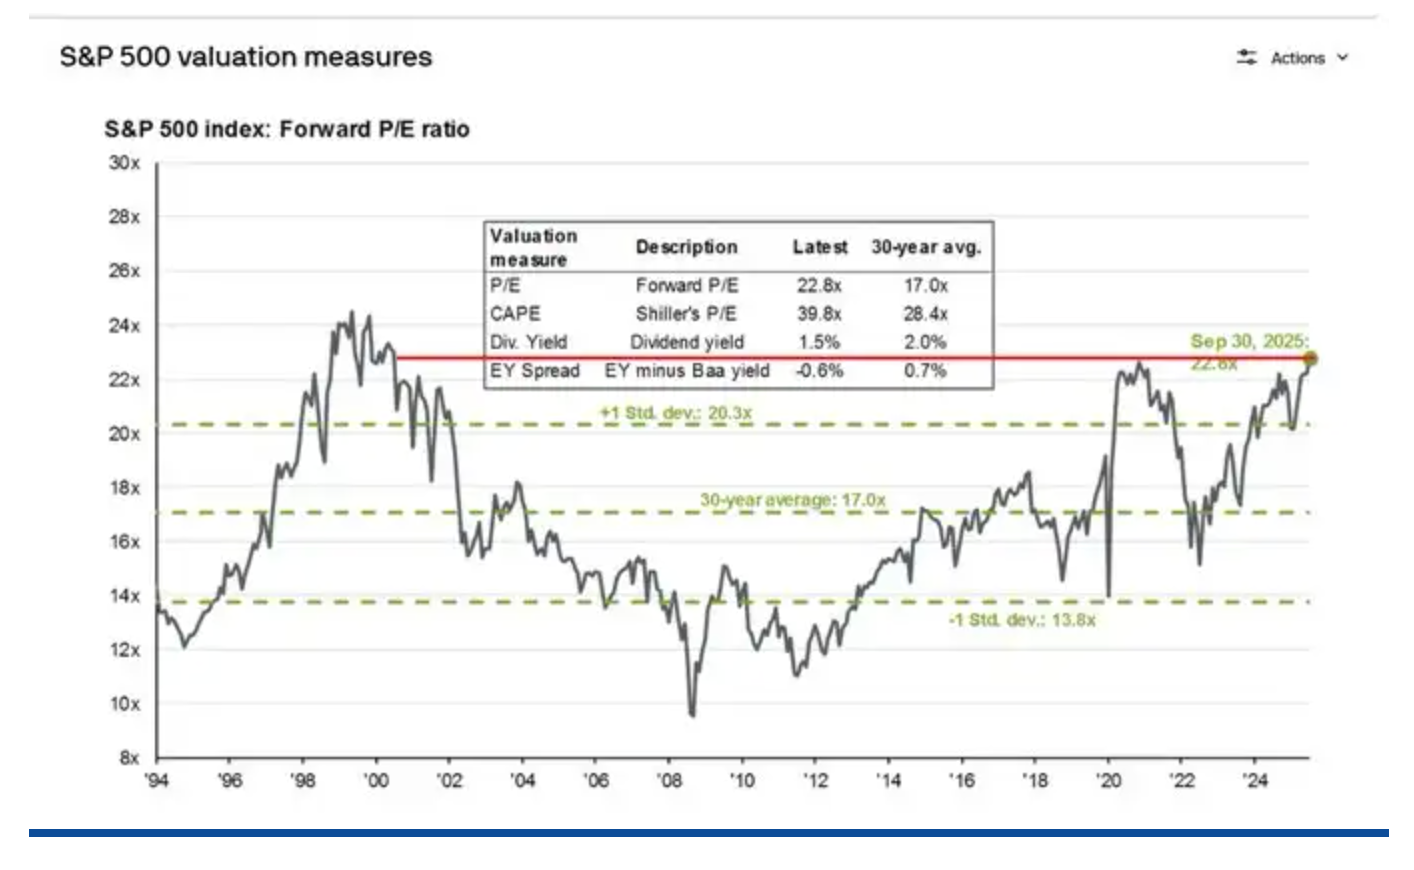
Most traditional valuation metrics approach the 98%-tile. Today's price-earnings multiple on the S&P Index is 23x — the highest in 26 years (back to the peak in the Dot-Com period) and compared to the 30-year long-term average of only 17x:
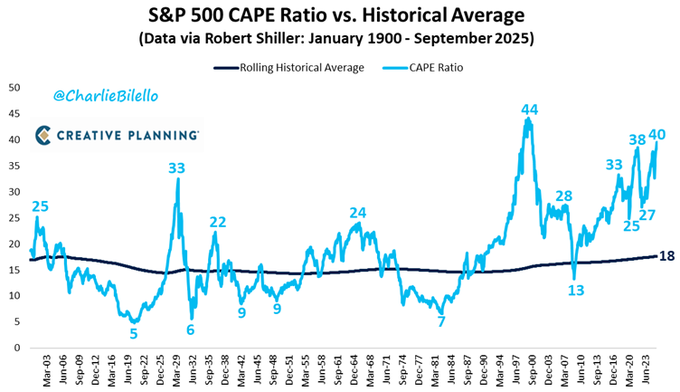
Dr. Robert Shiller's CAPE Ratio today is 40x vs 44x at the peak of Dot-Com and only 24x at the height of the Nifty Fifty Era. However, if we adjust profits for the low tax rates today compared to the peak in 2000 the Schillers CAPE is above 46x:
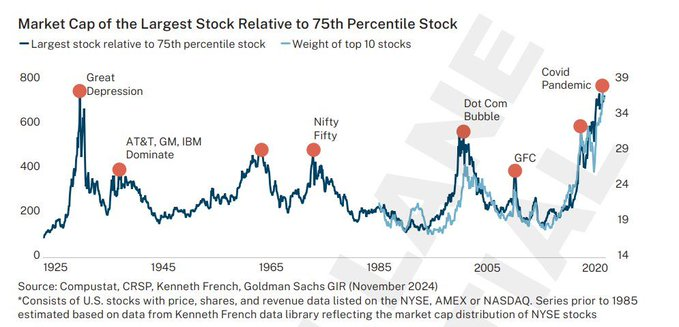
Today's unparalleled S&P concentration into a handful of large-cap tech stocks is similar (and more extreme) than in the prior bubbles. Such concentration when coupled with elevated valuations almost always is a poor launching pad for future investment returns and often presages substantive bear markets or extended periods of substandard returns (our base case):
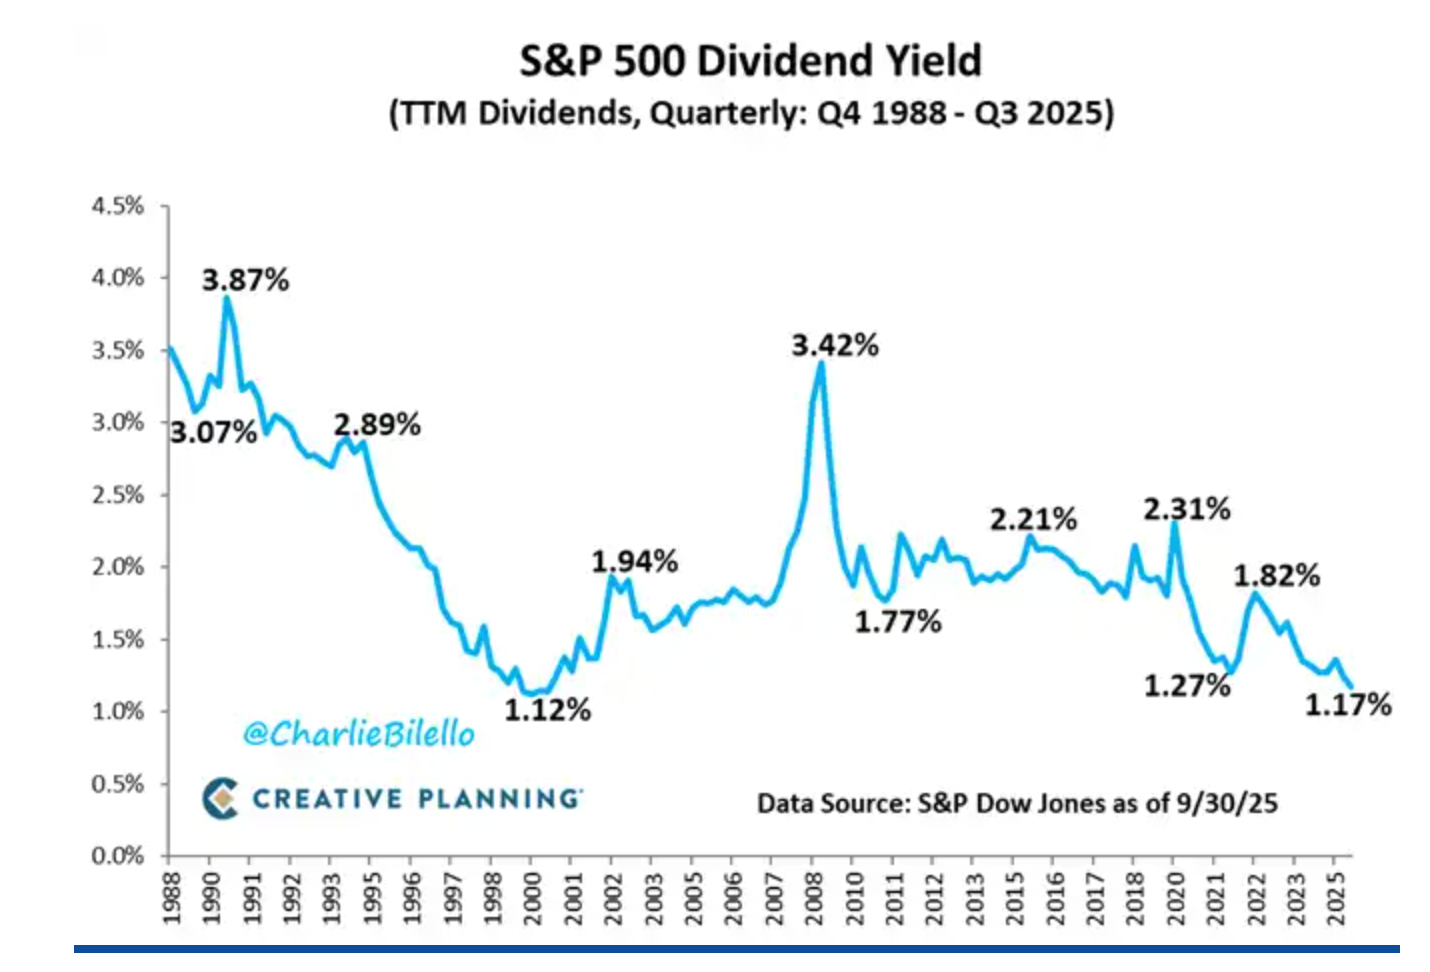
Let’s look at the similarity of the S&P dividend yield today compared to the peak of the Dot-Com Boom:
Over time dividends have contributed to about one-third of the total return for stocks — with the rest coming from capital appreciation. Today, the S&P Dividend Yield is only 1.17% — the lowest read in 2 1/2 decades (since the Dot-Com Boom). This means if S&P dividends maintain their 1/3 historical contribution to the total annual return for stocks, a 1.17% dividend yield translates into a lowly +3.5% total return for equities. With the S&P earnings yield of about 4.0% (the inverse of the P/E) and the 10-year Treasury yielding 4.15% — the equity risk premium is negative! The difference between the S&P dividend yield (1.17%) and the risk-free rate of return (4.15%) is also at a multiple-decade wide.
A low expected total return for equities coupled with a higher risk-free rate of return is fundamental to my bearish market case.
While I don't think the next few years will resemble the brutal declines of The Nifty Fifty (that began in 1973-74) of the Dot-Com bust (that commenced in early 2000), the downside to equities remains meaningful.
Could More Money Printing Insulate Equities From a More Significant Decline?
One of the most important factors that could insulate the S&P Index from the magnitude of the drawdown that I expect is if the current Administration is successful in persuading the Federal Reserve to adopt a very aggressive path to easing monetary policy. Events of the last few months suggest that President Trump will try his best to encourage the Fed to cut rates dramatically over the next six to 12 months.
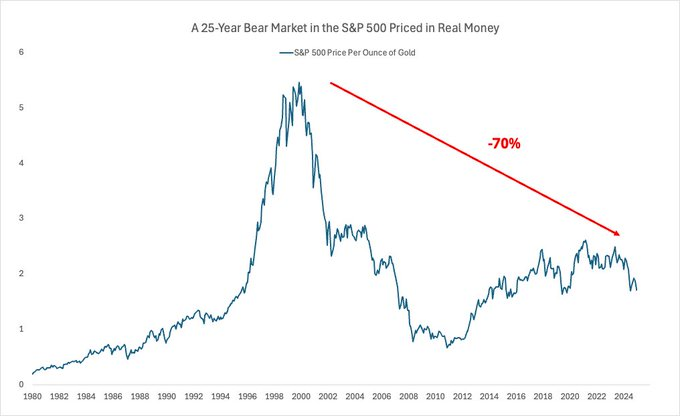
The excessive global easing of the past 15 years has been a money illusion that has created the mirage of wealth through excessive monetary ease and rampant currency devaluation. In real money terms, the S&P Index has lost 70% of its value in the last twenty-five years:
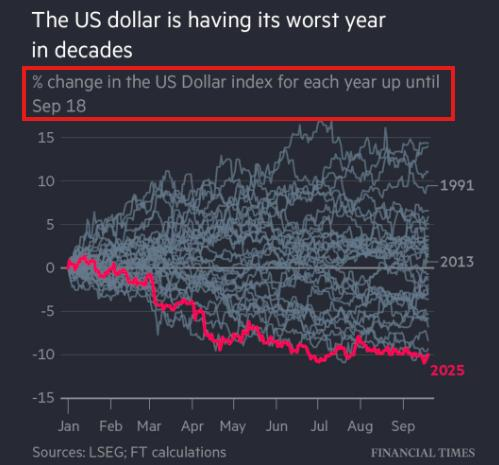
Our currency just saw its biggest six-month drop in 50 years. The U.S. dollar in now on track for its worst year since 1973 (-10% year to date) as the Federal Reserve cuts rates into relatively strong U.S. GDP and core inflation remains stubbornly high.
The U.S. isn't falling apart — we are still a leader in innovation, education, etc. But with our government debt out of control and inflation not in control, the rest of the world is adjusting their perception of us.
Confidence in our currency is changing as global investors are beginning to question the safety of holding U.S. assets. Non-U.S. investors are no longer willing to go all-in on the U.S. dollar as they are keeping one foot in growth (in U.S.-based equities) and the other in the safety (of non-U.S. currencies).
Gold is setting records daily as money is slowly leaving assets that depend on trust and moving into things that may be able to stand on their own like precious metals and cryptocurrencies.
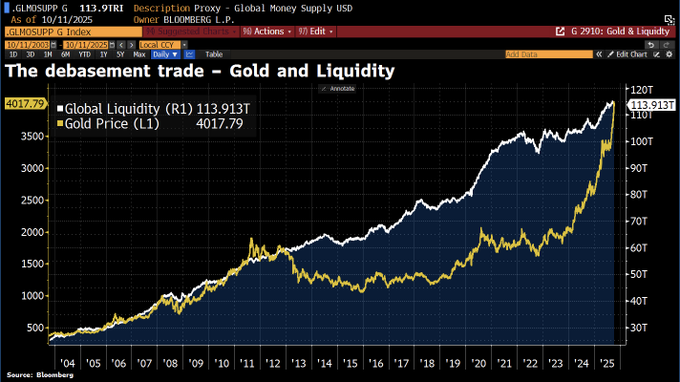
The debasement trade is in overdrive. To wit, gold, in particular, has recently climbed much faster than global liquidity, a clear sign of growing mistrust in the monetary system:
Even foreign investors who want exposure to U.S. companies have begun to hedge their returns into local currencies because they are losing confidence in U.S. policy and even in the generation of our economic data.
In summary, a more aggressive-than-expected monetary easing in the U.S. could contribute to the appearance of a better-than-forecast stock market going forward. (This expectation may explain the surprising strength in global equities this year.)
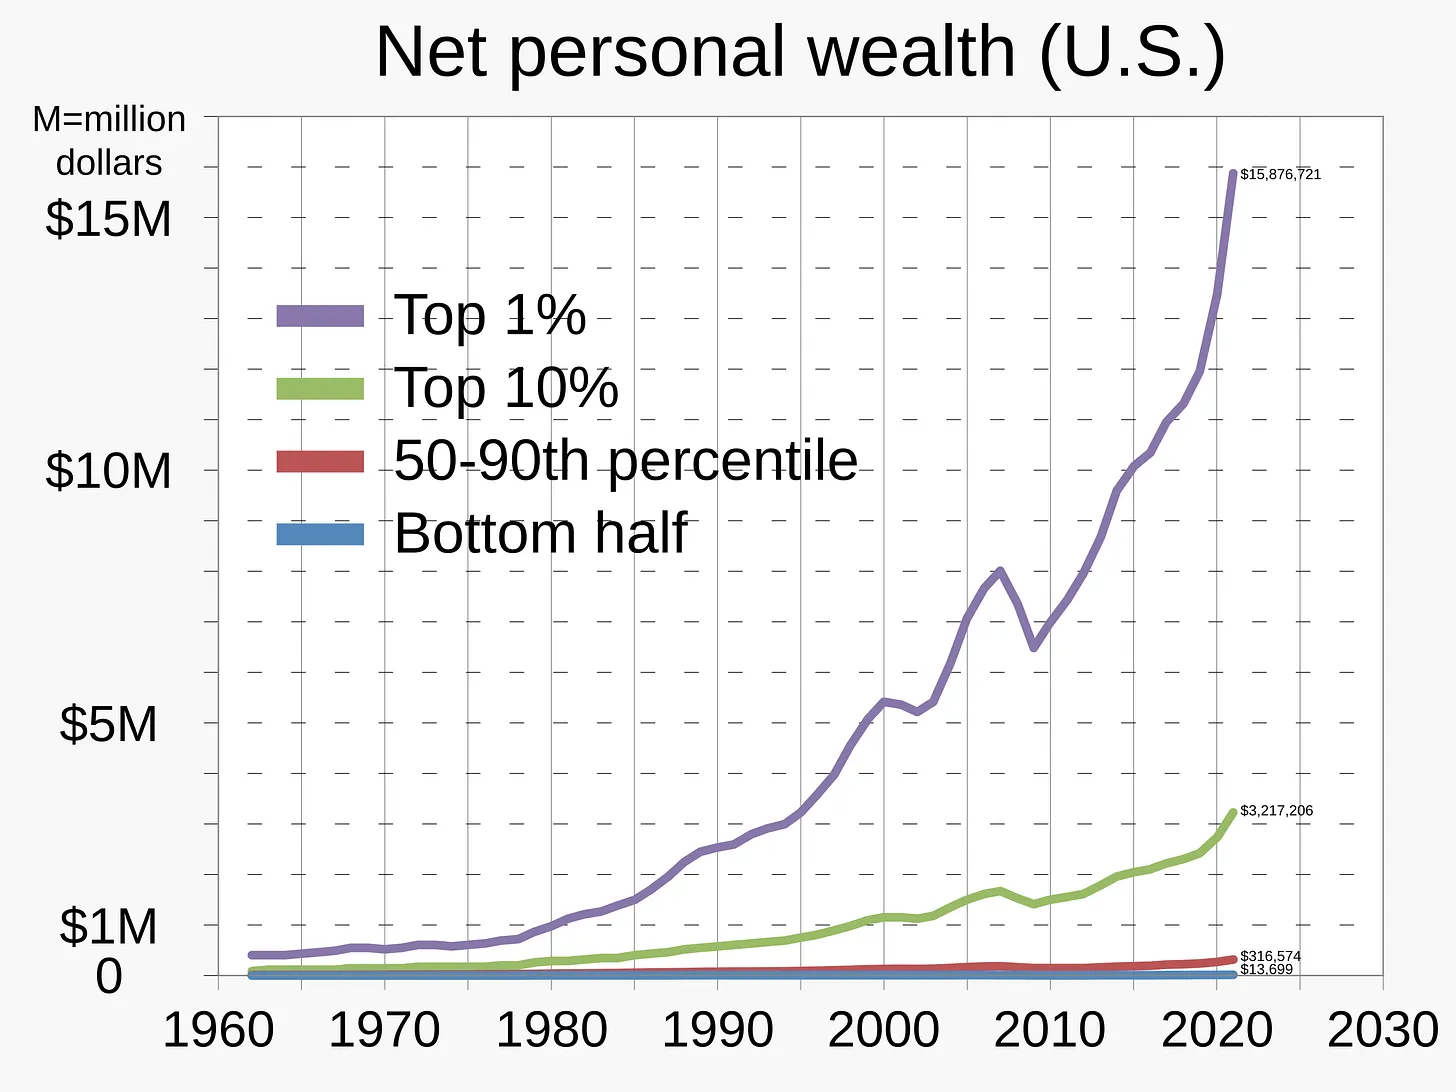
The problem is that this policy, if it continues, may serve to further widen the inequality gap — disproportionately affecting the middle and lower classes (who don't hold large balance sheets consisting of real estate and equities):
Under this circumstance, with inflation likely accelerating (as bond vigilantes come out of hibernation, causing intermediate-to longer-term interest rates to rise) in response to the Fed's interest rate cuts and with the likely continuation of irresponsible fiscal policies in Washington, D.C., the notion of American Exceptionalism might be seriously challenged.
Thus, higher equity prices, in nominal terms, may really be more of an illusion when coupled with a continued denigration in the U.S. dollar.
From Christopher Irons who writes under the pseudonym Quoth The Raven:
"There will come a point one day where, psychologically, the Fed intervenes and stock prices may go up again, but the average investor is living out depressionary hardships. And I mean this for people who are lucky enough to even own financial assets. Many lower- and middle-class families don’t even have significant amounts of financial assets but, rather, have negative net worth. The wreckage to these classes will be unlike anything we’ve ever seen before.
Make no mistake about it — we appear to be stuck between a rock and a hard place where the only exit door seems to be stagflation. This is something we haven’t combated since the 1970s, and the monetary policy and fiscal layout of the country right now is so distorted that people from the 1970s wouldn’t even recognize it.
The Fed has no option to raise rates into a stagflationary environment because of the ungodly amount of debt we have outstanding. Even with rates where they are now, I believe the Fed is out over its skis and has already sealed the fate of guaranteed defeat for the economy and markets.
So what happens then? We’re stuck between welcoming a deflationary depression by raising rates to try to combat inflation, or we’re going to have to let inflation run wild. We’ve never been in this situation before in modern history. And even more frightening than that is the fact that market participants and the average American citizen are the most coddled and the least equipped to handle bad news related to the economy than they’ve ever been."
Boockvar on Export Controls, Who Pays for Tariffs, Data Centers
From Peter Boockvar:
This is not 2018/Who's paying?/Why I won't invest in a physical data center
Agree or not with the use of export controls on tech/semi equipment/chips and tariffs on China but we are being reminded again that China is intent on going toe-to-toe with us and has plenty of leverage to do so. This is not 2018-2020 so there are major limits to the US attempt to deprive China of certain goods as they will retaliate right back to where it hurts us. And I’ll argue again that by denying China access to some of our high tech has only emboldened them to create it themselves where the end result will be a lost market for US companies in China and the establishment of a major competitor around the world. We’ll hear again from some on who has more negotiating leverage but it’s clear that we still both need each other in trading goods and services.
Meanwhile, on tariffs generally, Goldman Sachs is out today firming up its estimates on who is paying the tax. They said, “If recently implemented and future tariffs have the same eventual impact on prices as the tariffs implemented earlier this year, then US consumers would eventually absorb 55% of tariff costs.” They estimate that US companies are eating 22% of them while foreign exporters are getting stuck with 18%. The balance of 5% is being dodged via whatever methods.
When I think about these huge data centers that are being built and watching how technology has evolved over time, I will never invest in the physical structure of a data center. If there is a main lesson learned over time is that technology products get faster and smaller. A stereo system becomes a small tape deck then becomes a Walkman, soon to be followed by an Ipod and eventually fully replaced by an all encompassing smartphone which by the way replaced the initial attempts at a bulk cellular phone decades ago. The desktop personal computer finds a corollary in the laptop which only becomes smaller and quicker in speed over time. Remember the size of a TV before the flat screen? Or the initial iteration of a flat screen compared to the ones today.
My point is that the current data centers being built are so massive that as the equipment and chips being installed in them get smaller and more powerful over time, will all that space still be needed? For example, that 4 million square foot facility that Meta is building in Louisiana which is the size of 1,700 football fields is mind blowing large. Putting aside the energy demand needed to power it, what if in three years only 2 million or 3 million of the available square footage is needed to house all the server/chip/HVAC/cooling, and other equipment to produce even more computing power? I know the demand for compute will only go up in the years to come but the ability to serve that might only get more efficient and smaller over time.
I welcome feedback, push back and critique to my thoughts if I’m not thinking about this right.
Back to China, they reported an 8.3% y/o/y increase in exports in September while getting no help from the US. The estimate was up 6.6%. Exports to the US were down by 27% y/o/y but lifted by 14% to the EU, by 15.6% to Southeast Asia and by 56% to Africa. They are clearly diversifying their global trade exposure away from the US to the point where exports to the US make up less than 10% of total exports. Yes, they are producing product in other countries that are then shipped to the US but I can’t quantify to what extent in terms of what the total figure would be to the US from Chinese companies.
Imports to China jumped by 7.4% y/o/y, well above the estimate of up 1.8% with the help of commodity buying of crude oil and soybeans.
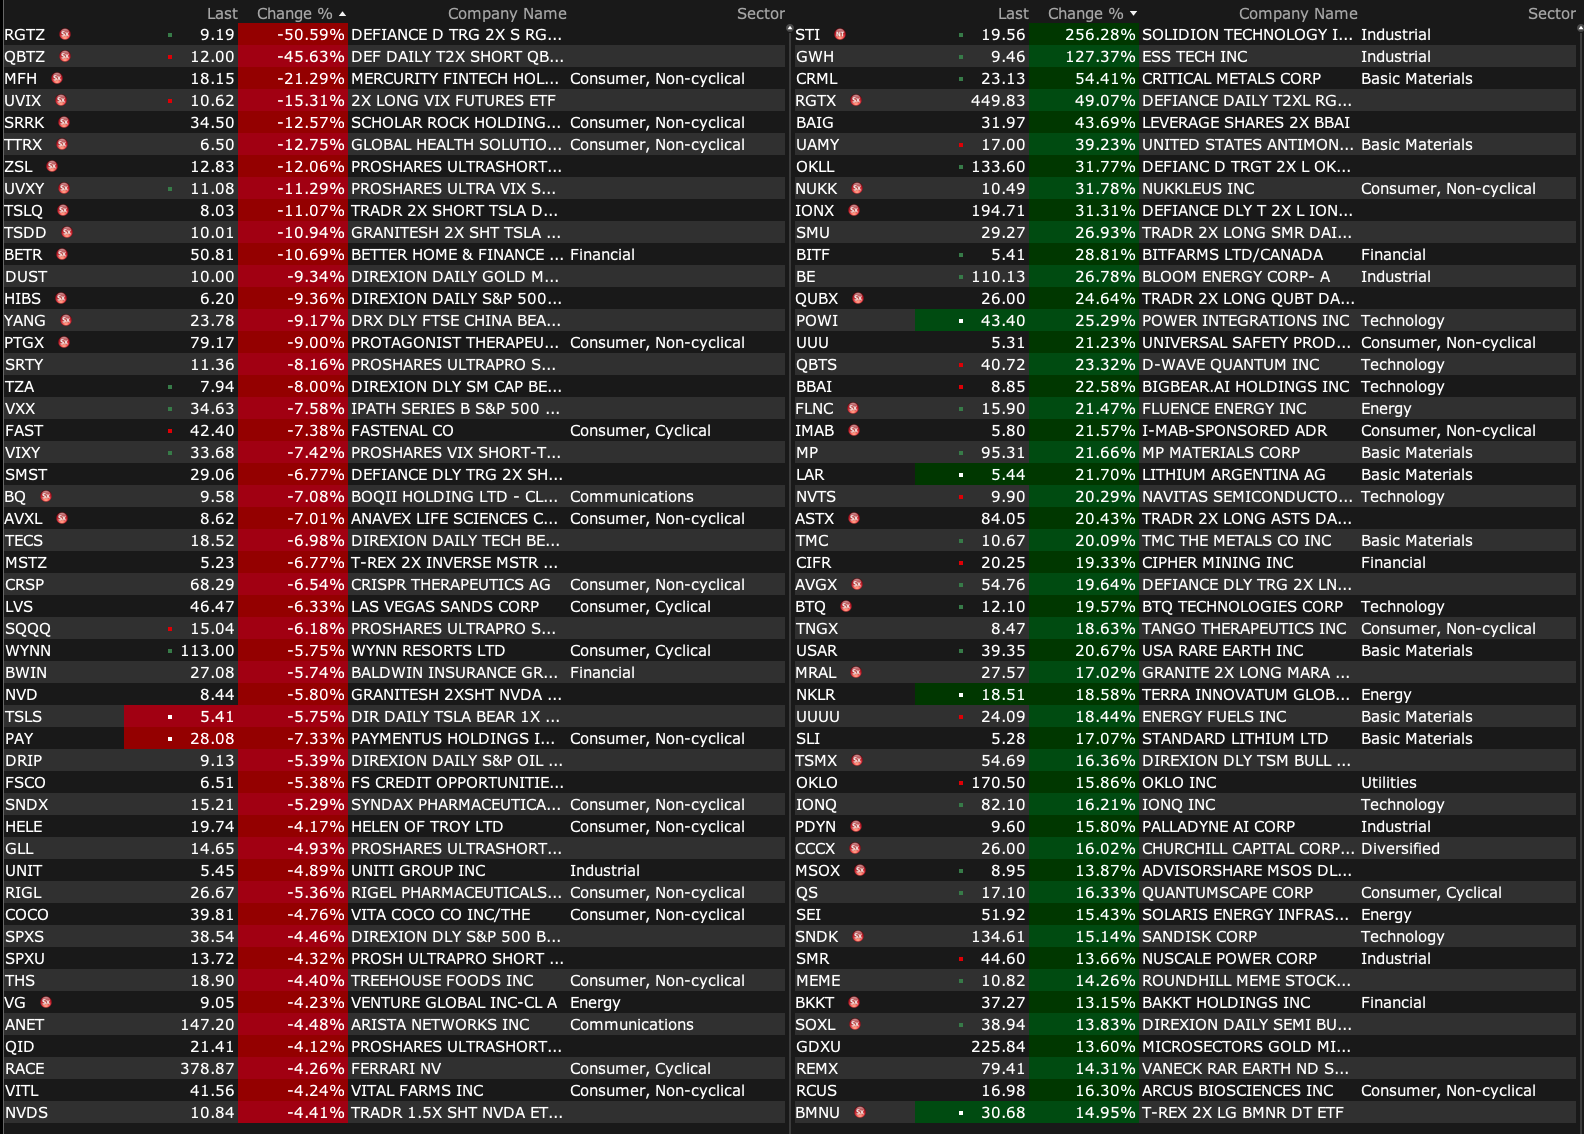
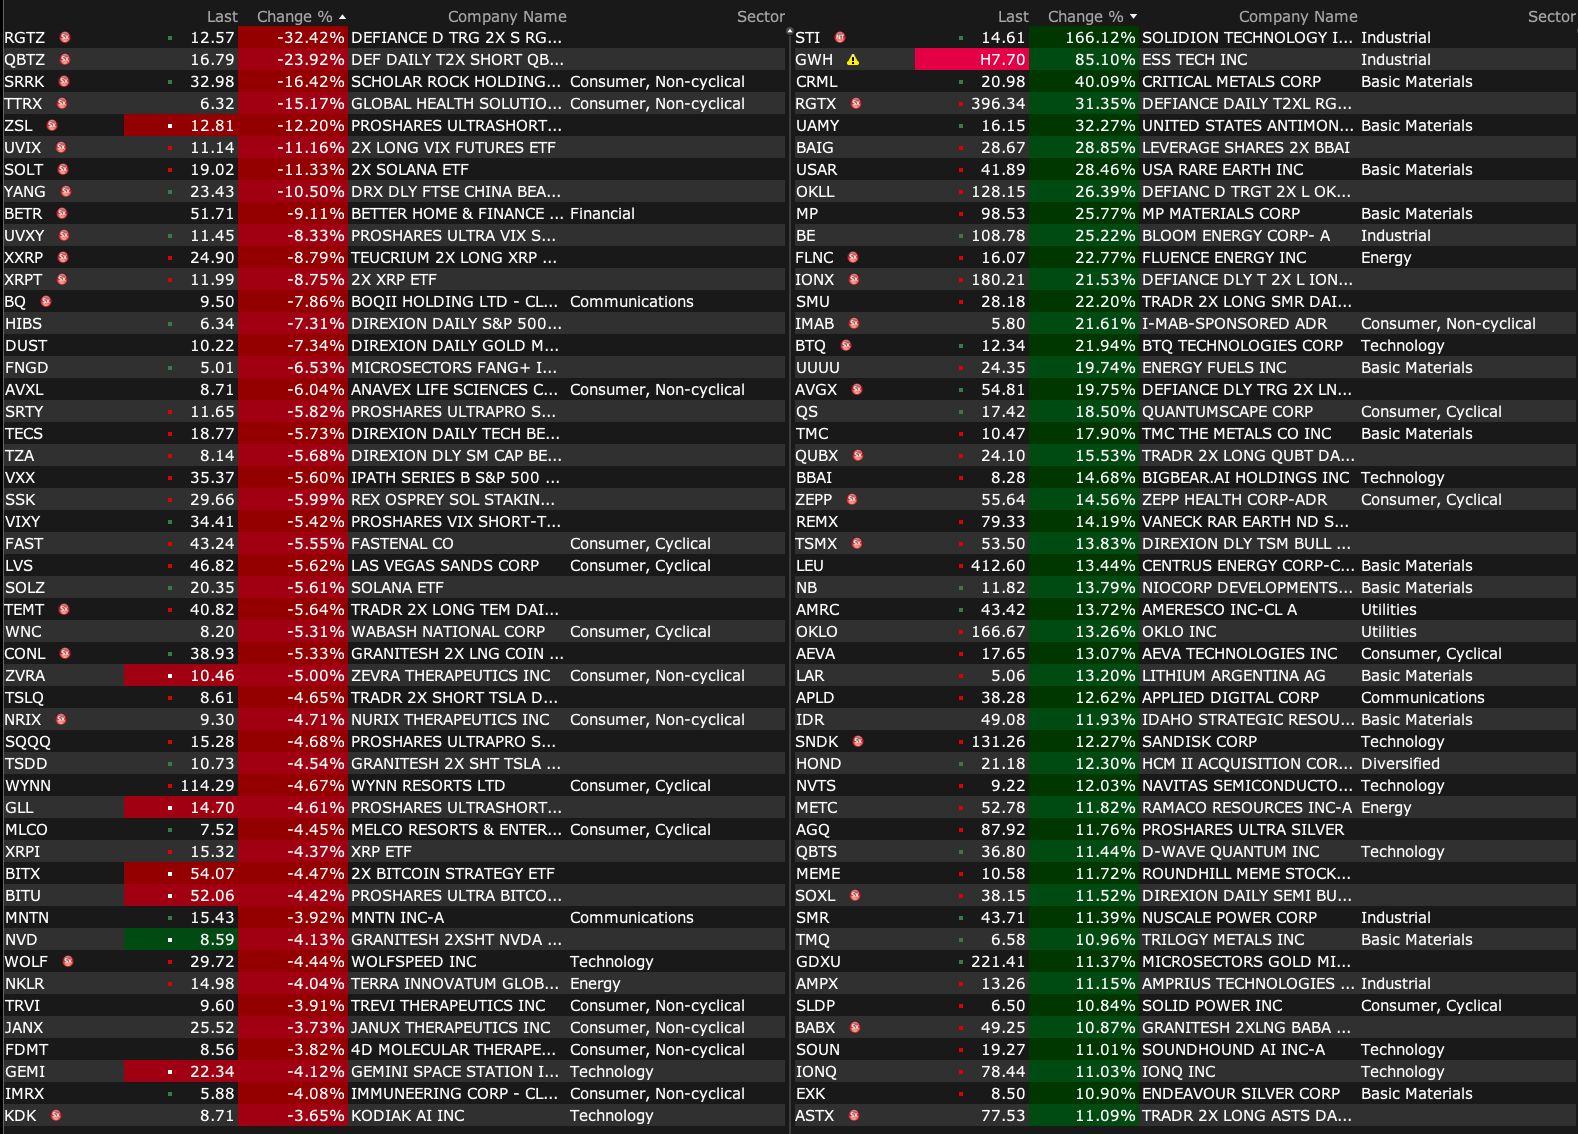
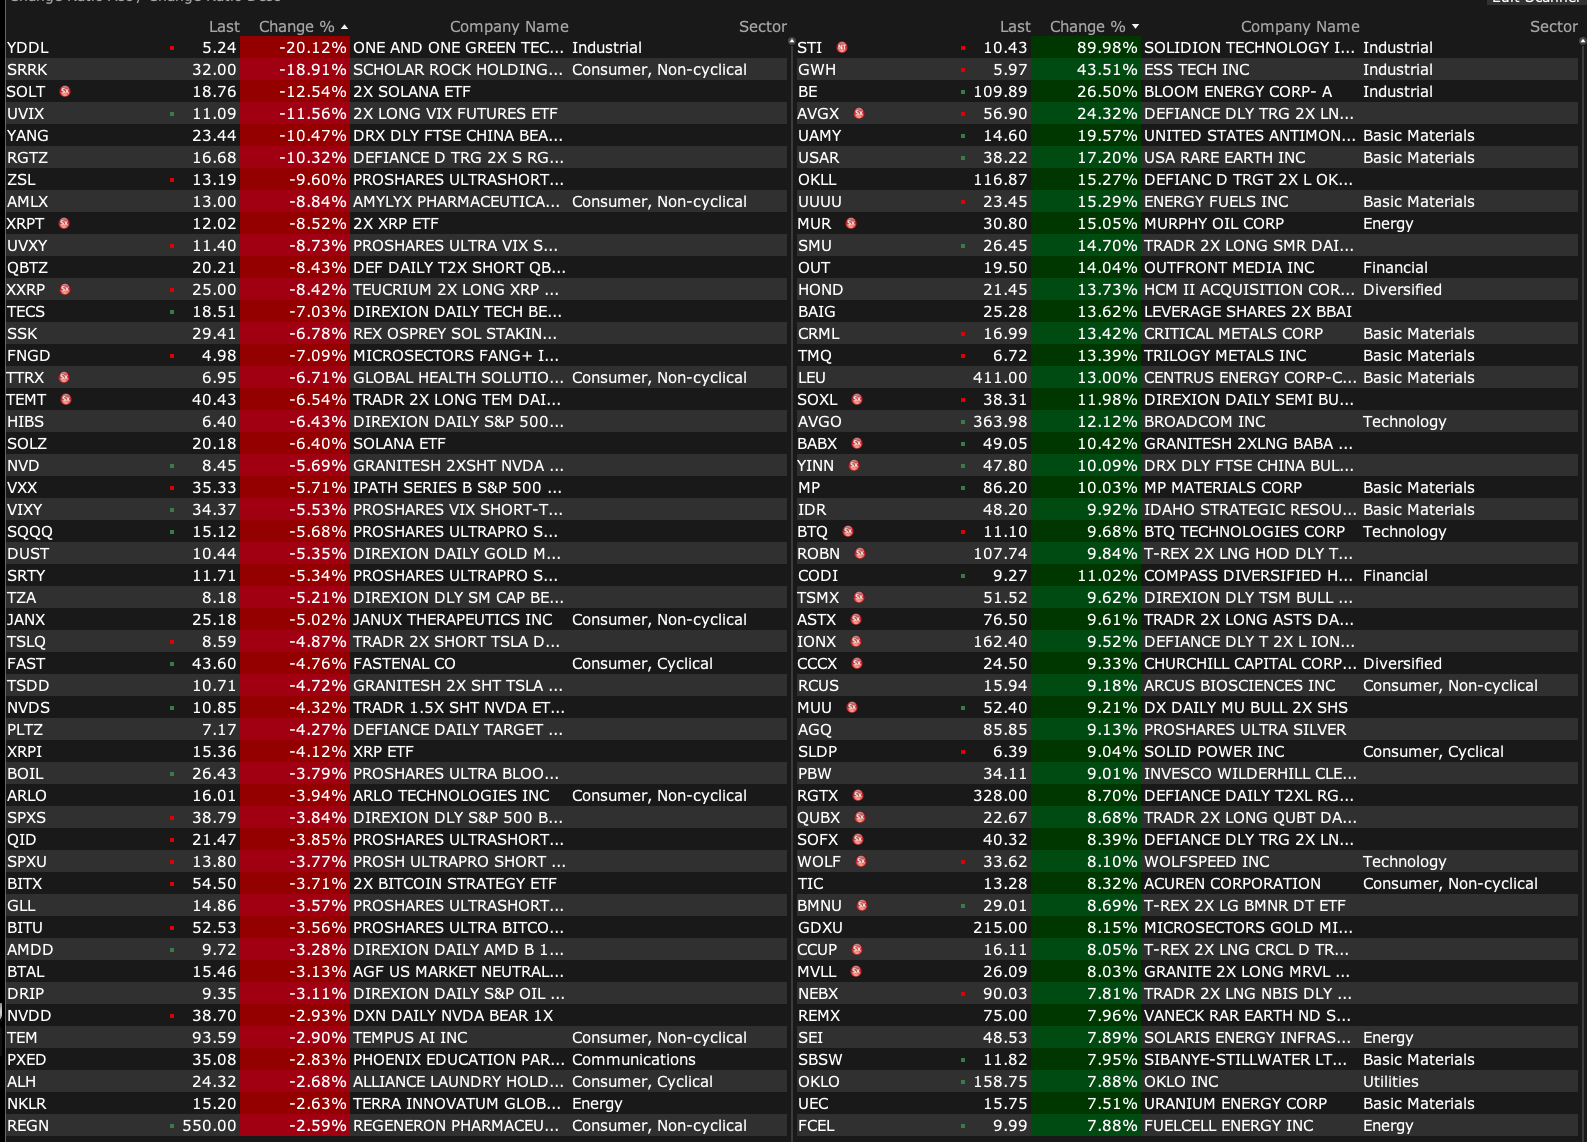
-BE +28% (Brookfield to invest up to $5B to deploy Bloom’s advanced fuel cell technology; Bloom Energy to become preferred onsite power provider for Brookfield’s global AI factories)
-USAR +17% (rare earth miners strength following renewed China trade tensions)
-ASPI +16% (acquires independent radiopharmacy located in Florida)
-RKLB +7.1% (hearing Morgan Stanley raises target price to $68 from $20)
-BCAX +6.9% (Ficerafusp Alfa Granted Breakthrough Therapy Designation by U.S. FDA for 1L HPV-Negative R/M HNSCC)
-KLAC +4.8% (multiple price target raises at brokerages)
-MU +4.7% (Exane BNP Paribas Raised MU to Outperform from Underperform)
-EL +4.6% (Goldman Sachs Raised EL to Buy from Neutral, price target: $115 from $76)
-WBD +4.5% (said to reject the initial $20/shr offer from Paramount Skydance as too low)
-NBIS +3.9% (positive broker commentary)
-VRT +3.4% (appoints Craig Chamberlin as CFO)
-NVDA +3.1% (momentum)
-PANW +2.5% (BTIG Raised PANW to Buy from Neutral, price target: $248)
-DIS +2.1% (Taylor Swift Eras Tour docuseries, Vancouver concert film coming to Disney+)
Downside:
-TVRD -87% (preliminary data from Phase 2 IPF trial of TTI-101 misses goals)
-BYND -58% (announces Early Tender Results and Early Settlement for Exchange Offer and Consent Solicitation with Respect to Existing Convertible Notes)
-SRRK -14% (provides update on 3rd party manufacturing site)
-NXL -8.0% (prepares for FDA Meeting, related to Q-submission, later this year)
US MKT INTEL – A buy-the-dip moment is forming. Remain Tactically Bullish, though with some very near-term caution. We also provide color on other trade developments, gov’t shutdown, Feroli’s weekly data forecast, and Abiel on labor markets. We update our Monetization Menu.
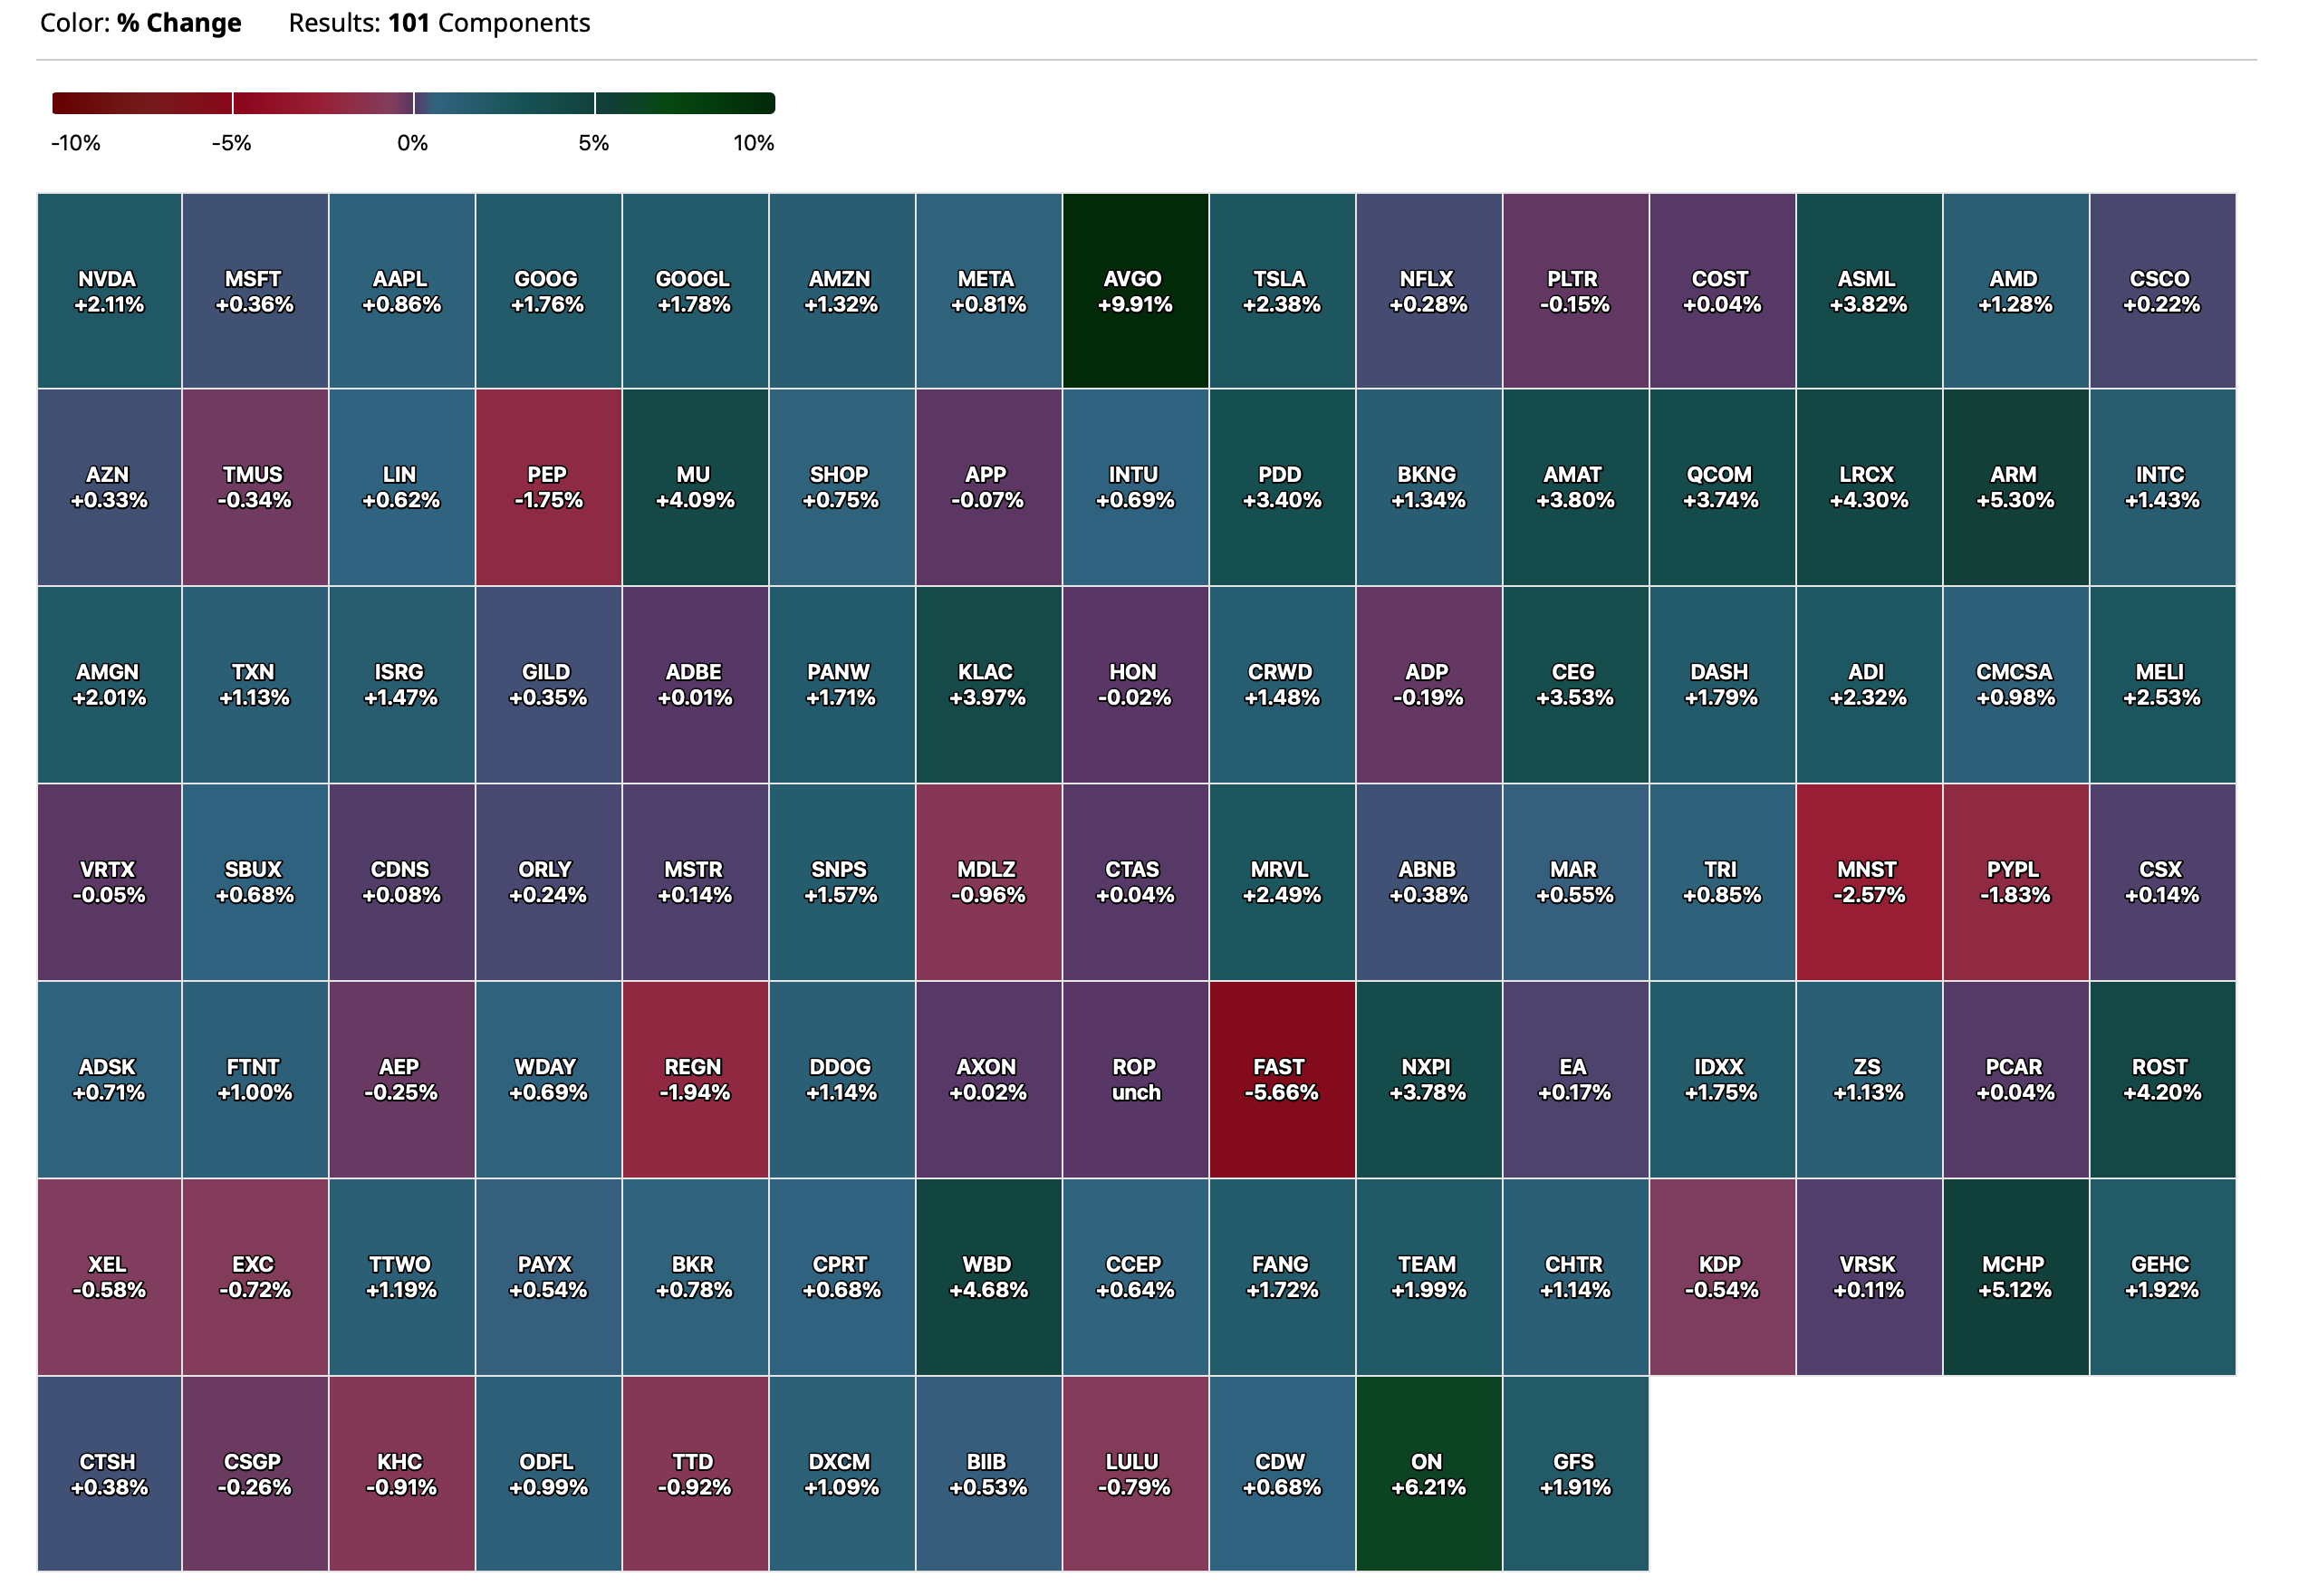
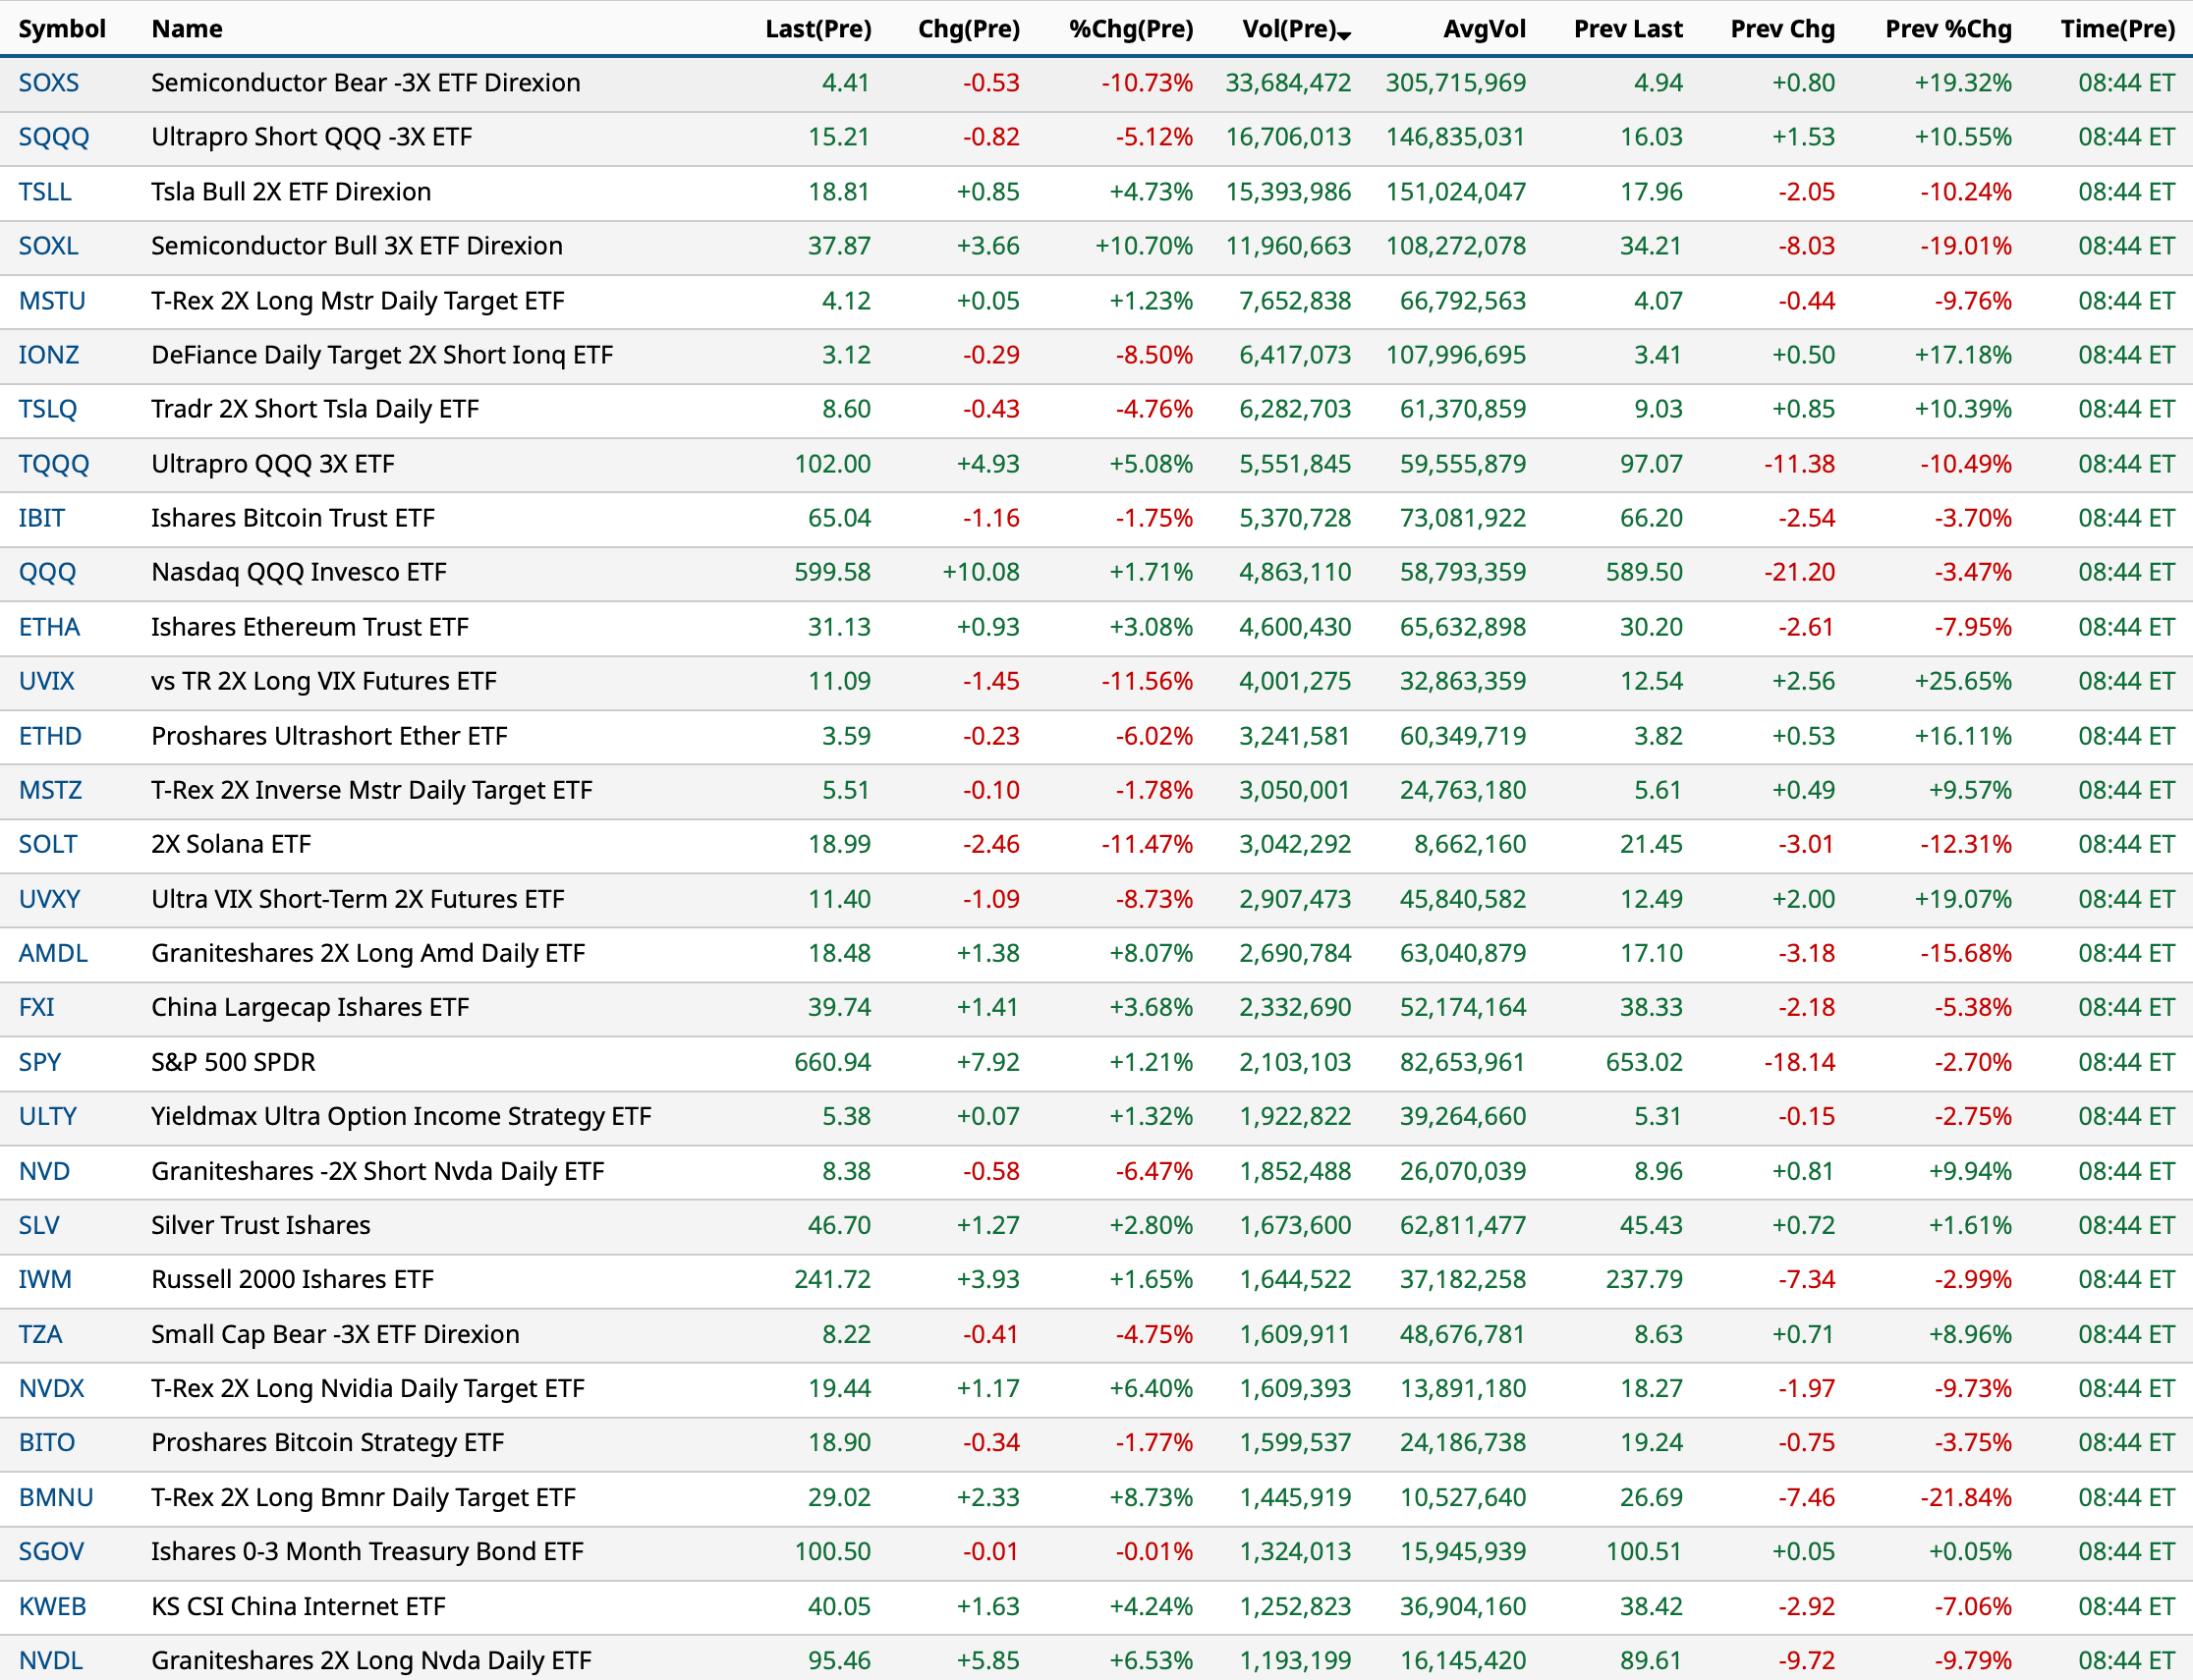
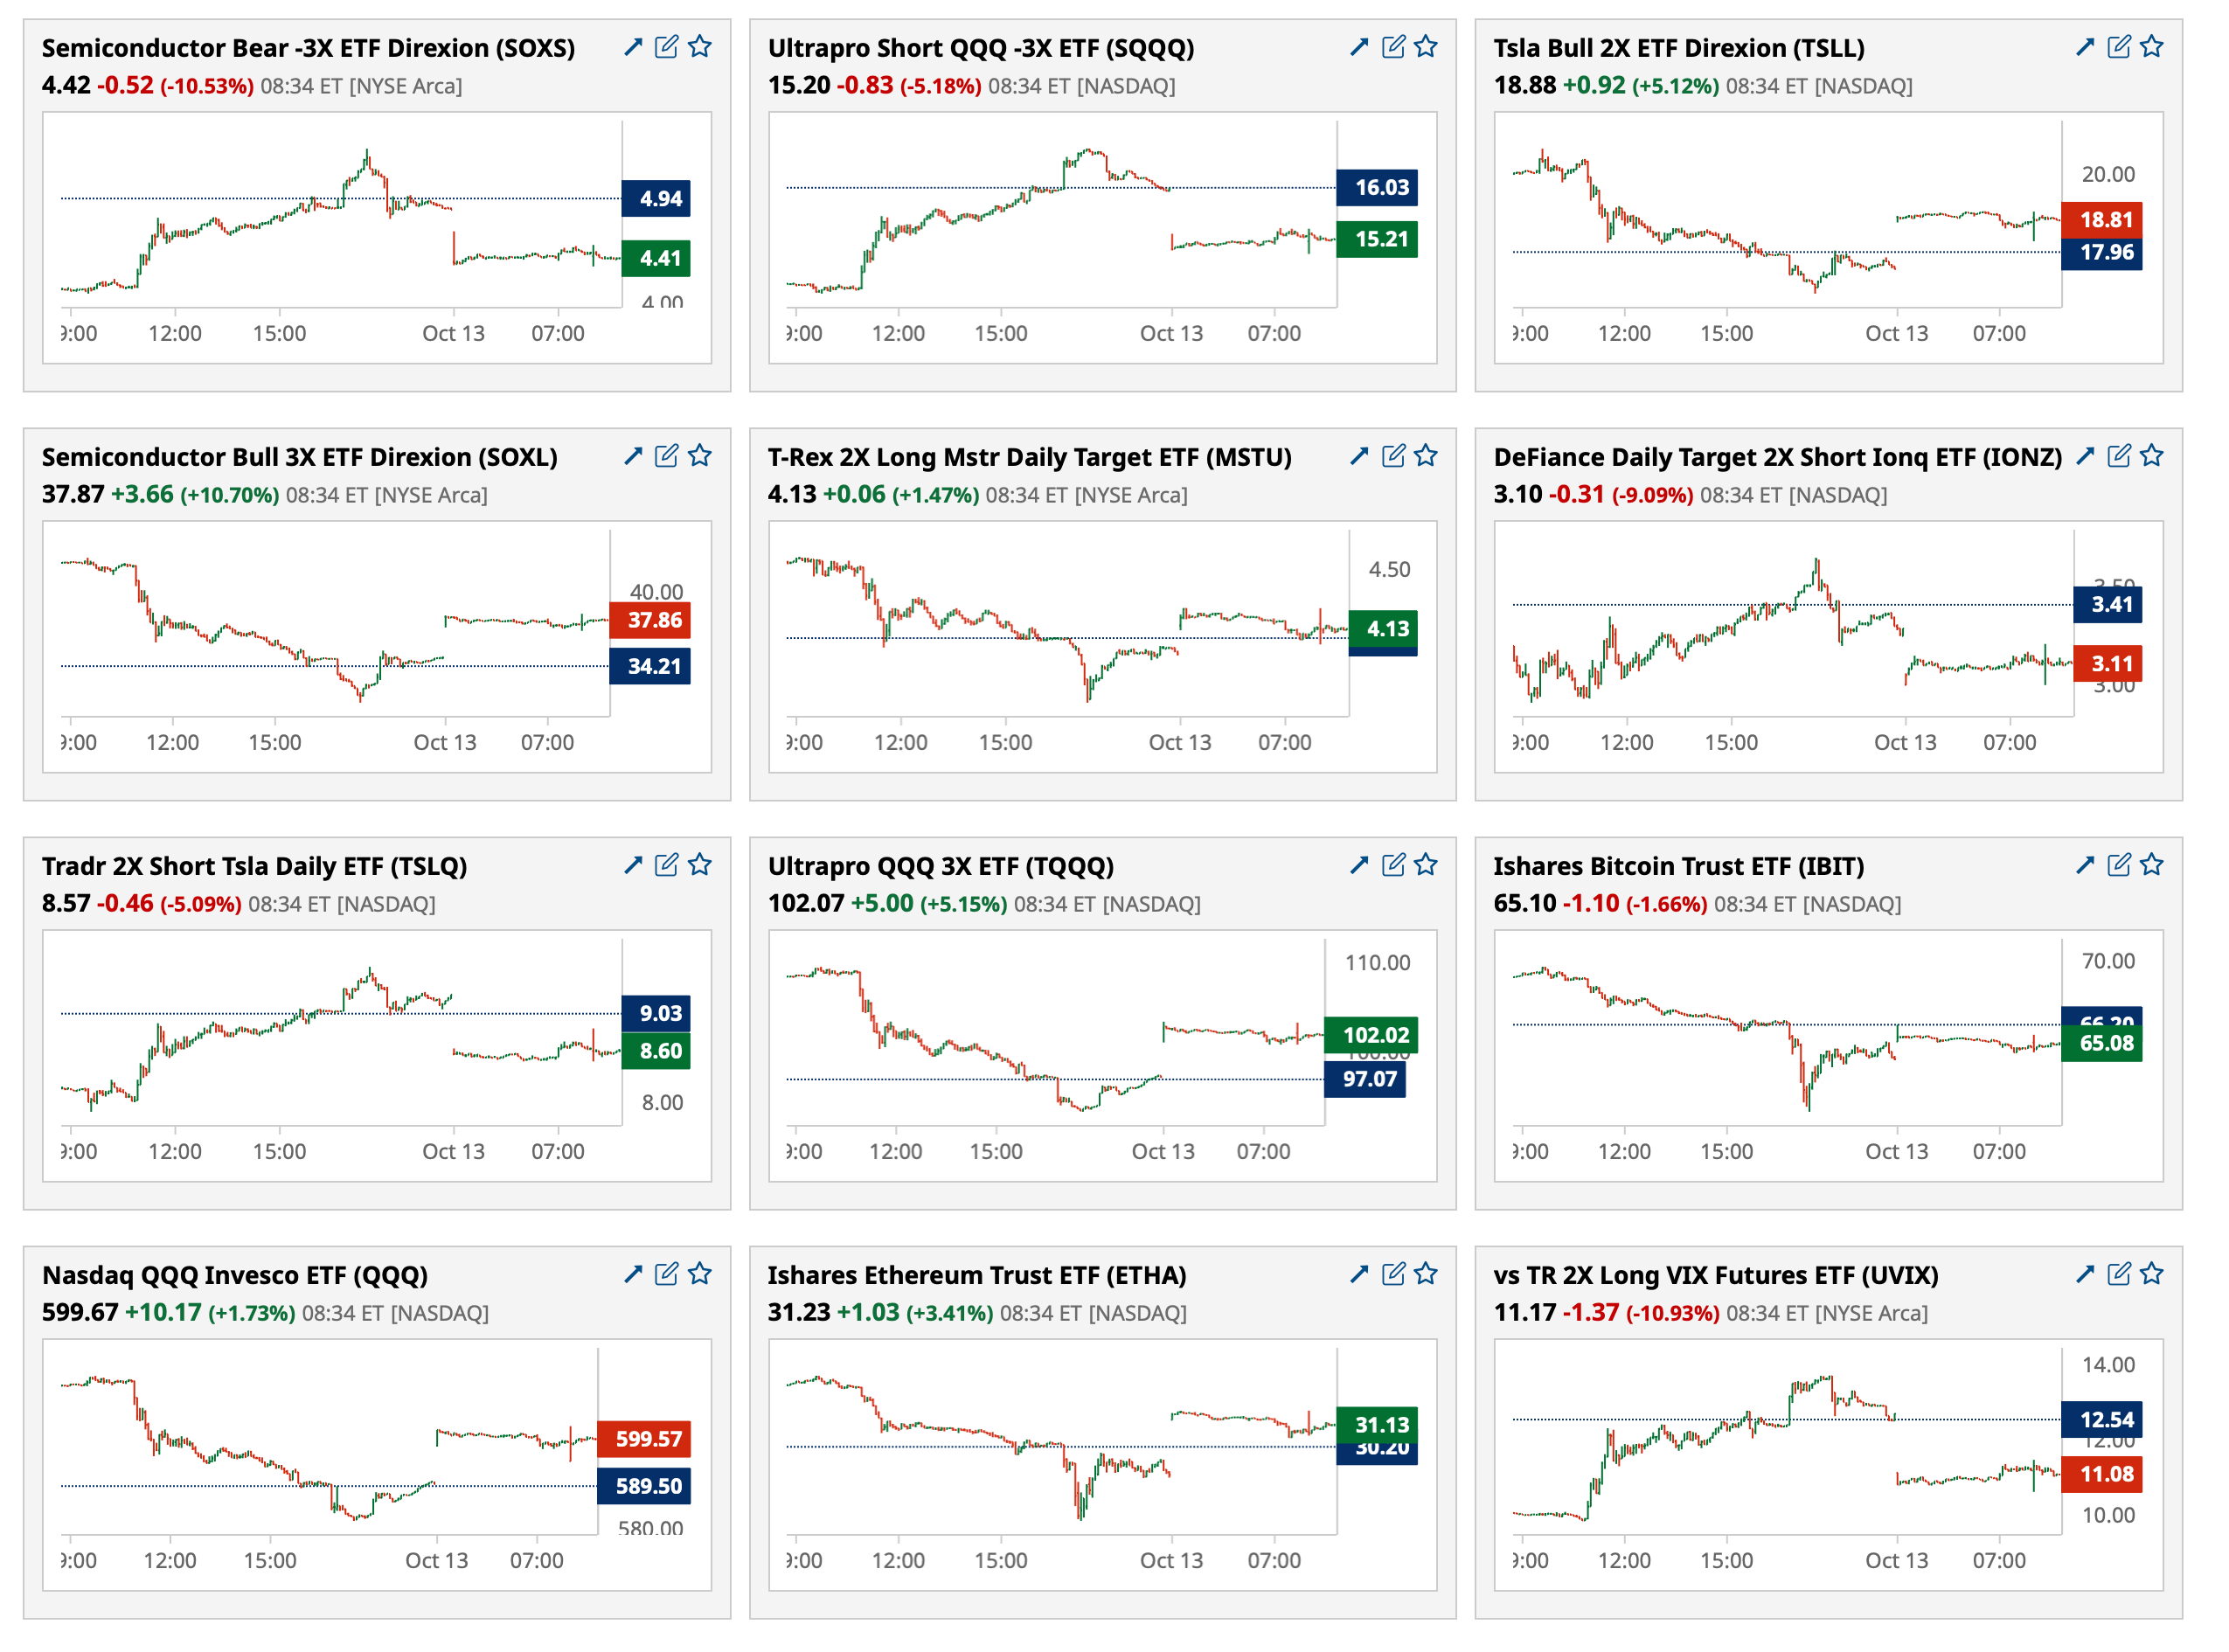
US: Futs are higher as Trump strikes a reconciliatory tone in social media posts yesterday. Futures point to ~50% retracement of Friday’s losses with Tech leading an ‘Everything Rally’ as the bond mkt is closed for the holiday and there are no expected data releases. Mag7 and Semis among the largest gainers pre-mkt. Cyclicals are seeing material outperformance to Defensives with rare earth plays seeing double-digit gains. In cmdtys, all 3 complexes are recovering with crude and precious metals the standouts.
and...
JPM MARKET INTEL EQUITY & MACRO NARRATIVE
On Friday, the SPX lost 2.7%, its biggest decline since Apr 10 of this year, pulling the index to a 2.4% loss on the week and 3% below ATHs set on Wednesday. Trump’s comments on China were the primary catalyst though many viewed the market as over-extended before the sell-off. Into the bell on Friday, selling accelerated into the bell with levered ETFs likely having to sell stock, the majority of which was in TMT. Post-market, Trump clarified his comments by stacking a 100% tariff on China. Now, the question is whether this is the extent of the flush or whether there may be more to come. On Sunday afternoon, Trump posted a reconciliatory tweet (see below) which has started a global rally.
We are of the view that investors should buy the dip as we maintain our Tactical Bullish view but think it prudent to exercise cautious in the very near-term. Our bullish view is guided by (i) resilient macro data, (ii) positive earnings growth where expectations could increase materially if Banks do well this week; and (iii) the potential for de-escalation in the trade war not just US / China but US / EU, US / UK, and US / Canada. Our caution is driven by (i) Positioning – our colleagues on the Positioning Intel team flag the pullback risk which typically triggers a 5% - 8% pullback. More color on this is in their Friday note and is summarized below. (ii) Trade war / ‘Liberation Day’ 2.0 – with Trump threatening a stacking of a 100% tariff, which would drive US / China trade to zero and trigger a global, stagflationary move, the risk is stems from potential escalation into a meeting ~Oct 30 / 31, or potentially at this week’s IMF conference. (iii) Valuation relief – many had been flagging that the US needed blowing some of the froth off the market, which may still occur, but more generally the risk / reward was moving towards a more defensive approach.
As I posted in my Diary I covered all of my index shorts, all of my financial shorts and a number of my trading short rentals late Friday afternoon into the whoosh lower — in total I covered nearly fifteen individual equity shorts and all of my (SPY) and (QQQ) :
Covering Index Shorts on 'Truth'
I have covered all of my Index shorts on the -60 handle whoosh lower in the S&P futures based on the Trump Truth Social post.
I also highlighted an area of concern (I remain concerned) in the leverage alt crypto market (which has proven correct — just read how many crypto traders were margined out in the Friday swoon):
Where Is the Leverage? Where Is the Systemic Risk?
Michael Saylor, chairman and chief executive officer at MicroStrategy
A thought for the weekend.
I think the biggest risk is the circularity.
The whole market is like bowling pins with bitcoin on of the most important pins.