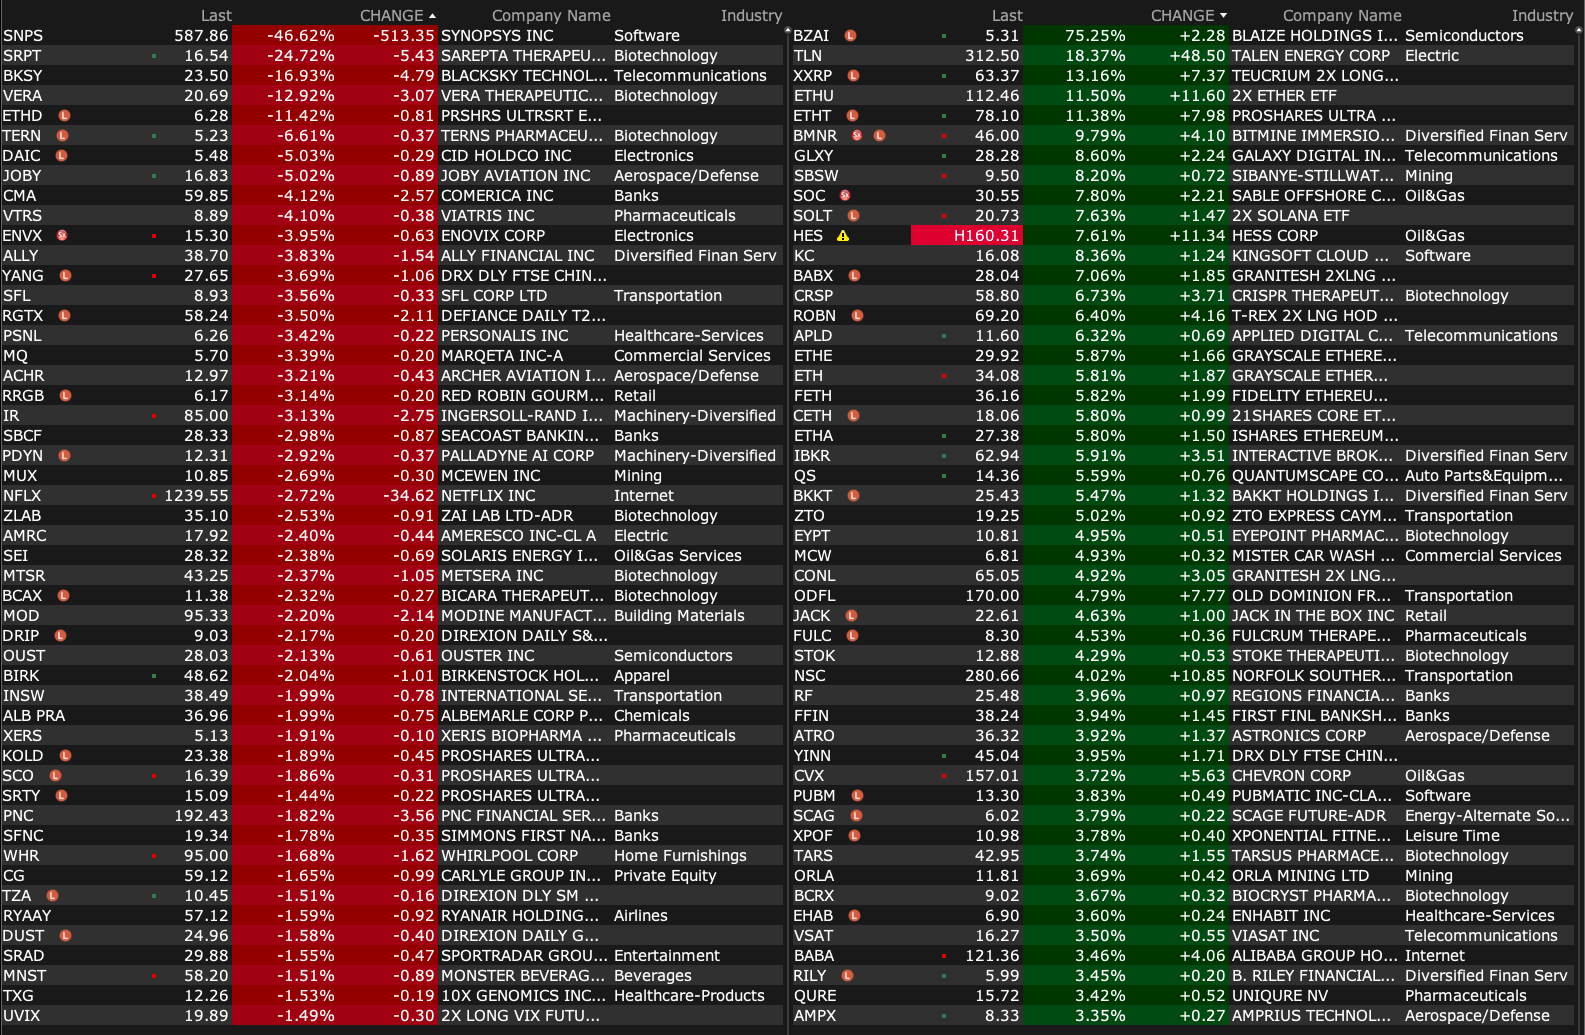
Friday's Closing Breadth, Sectors & Heat Map
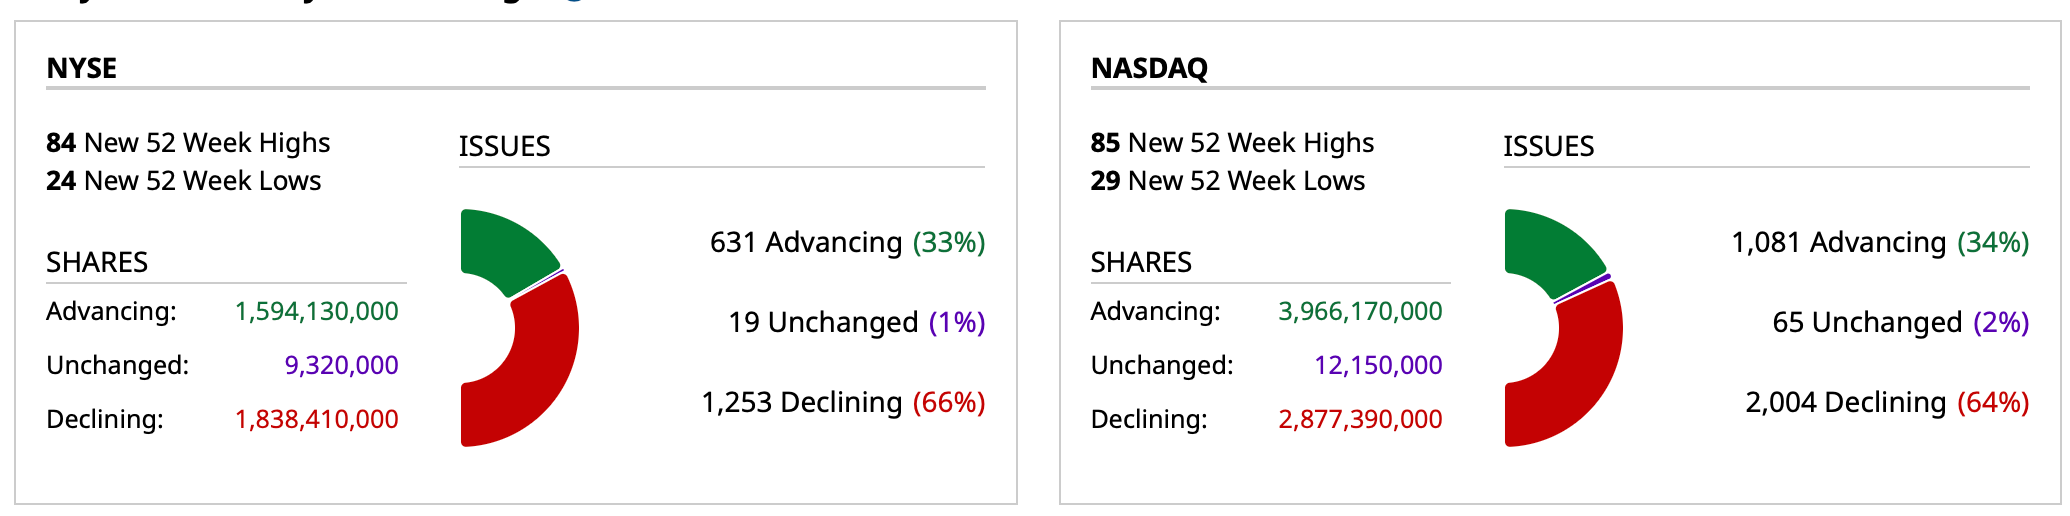
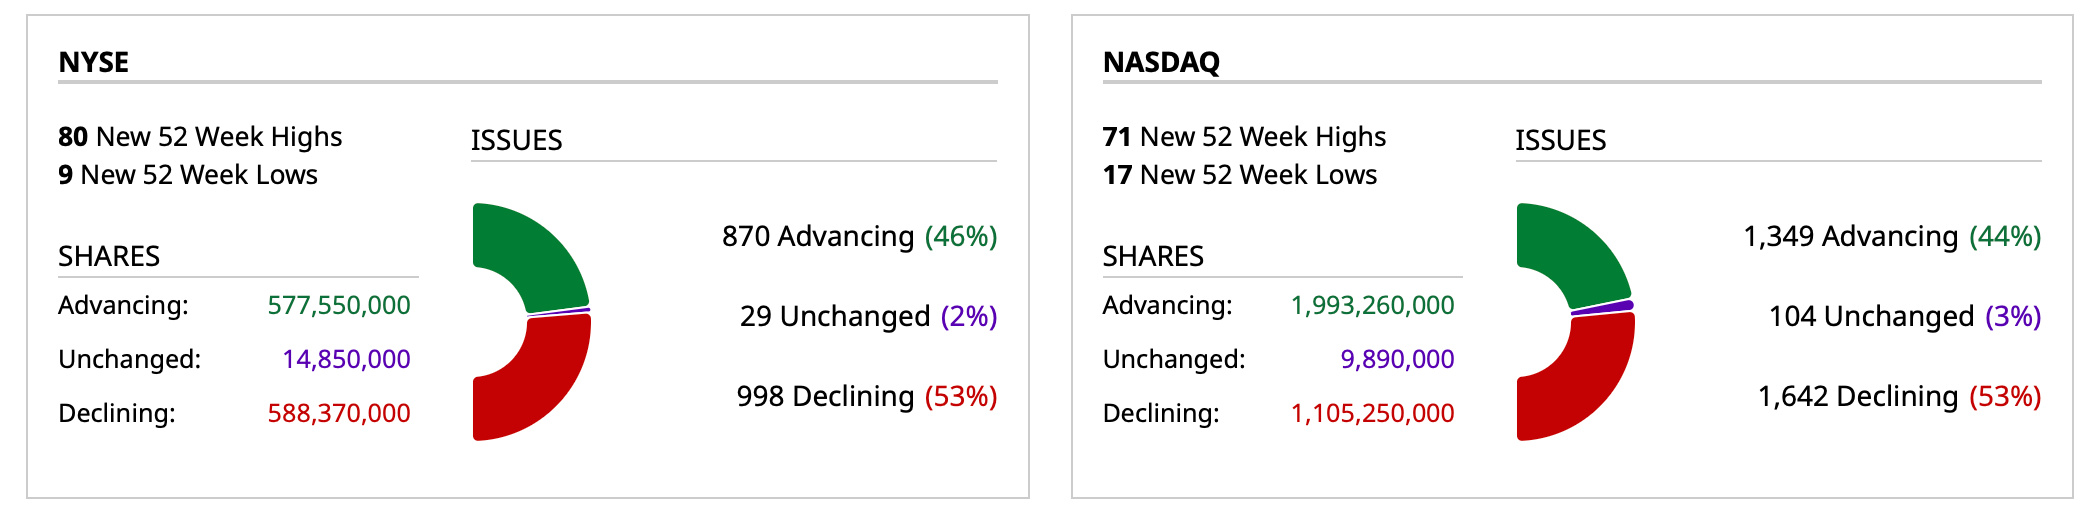
Closing Breadth
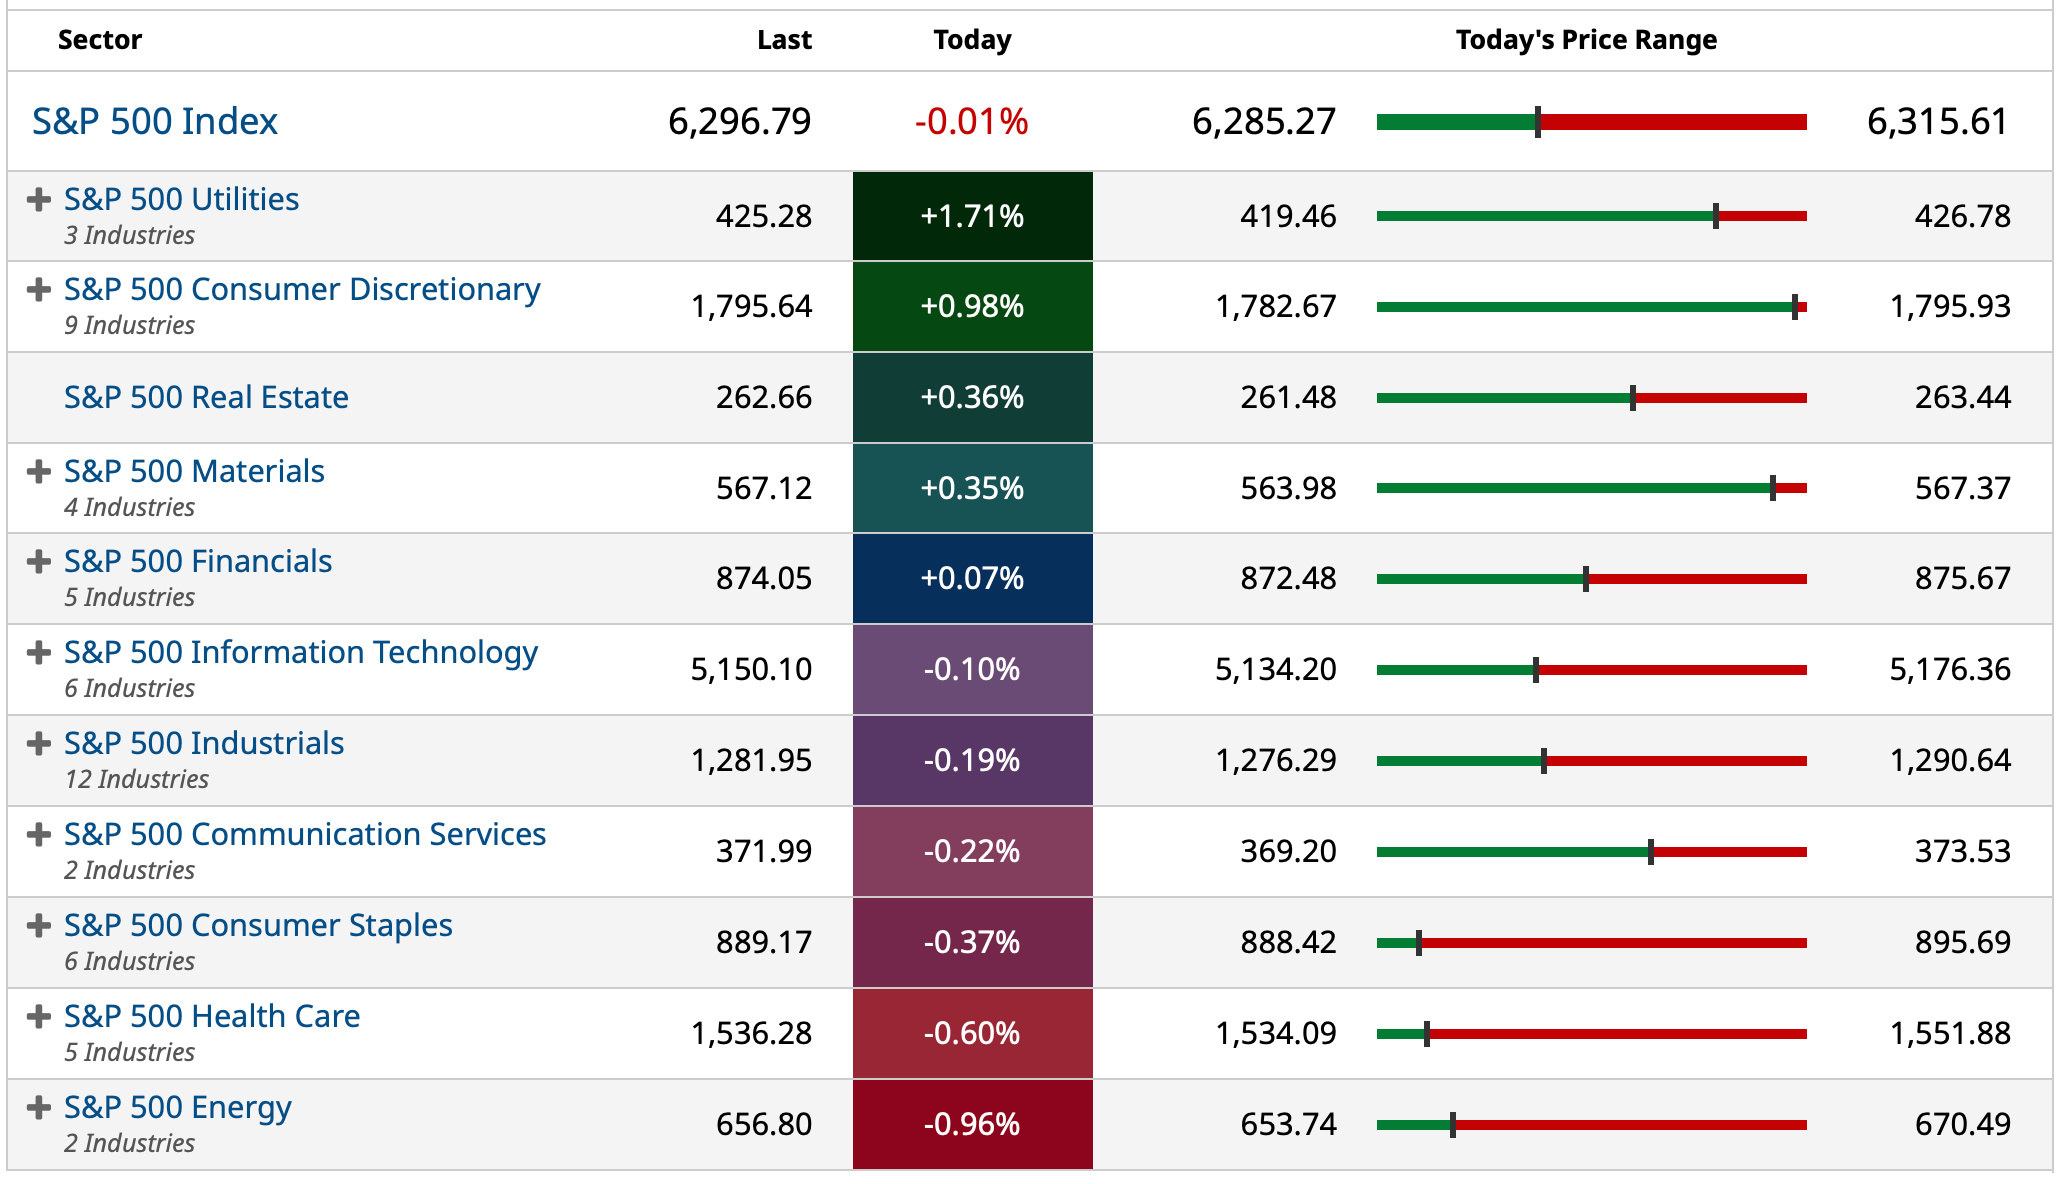
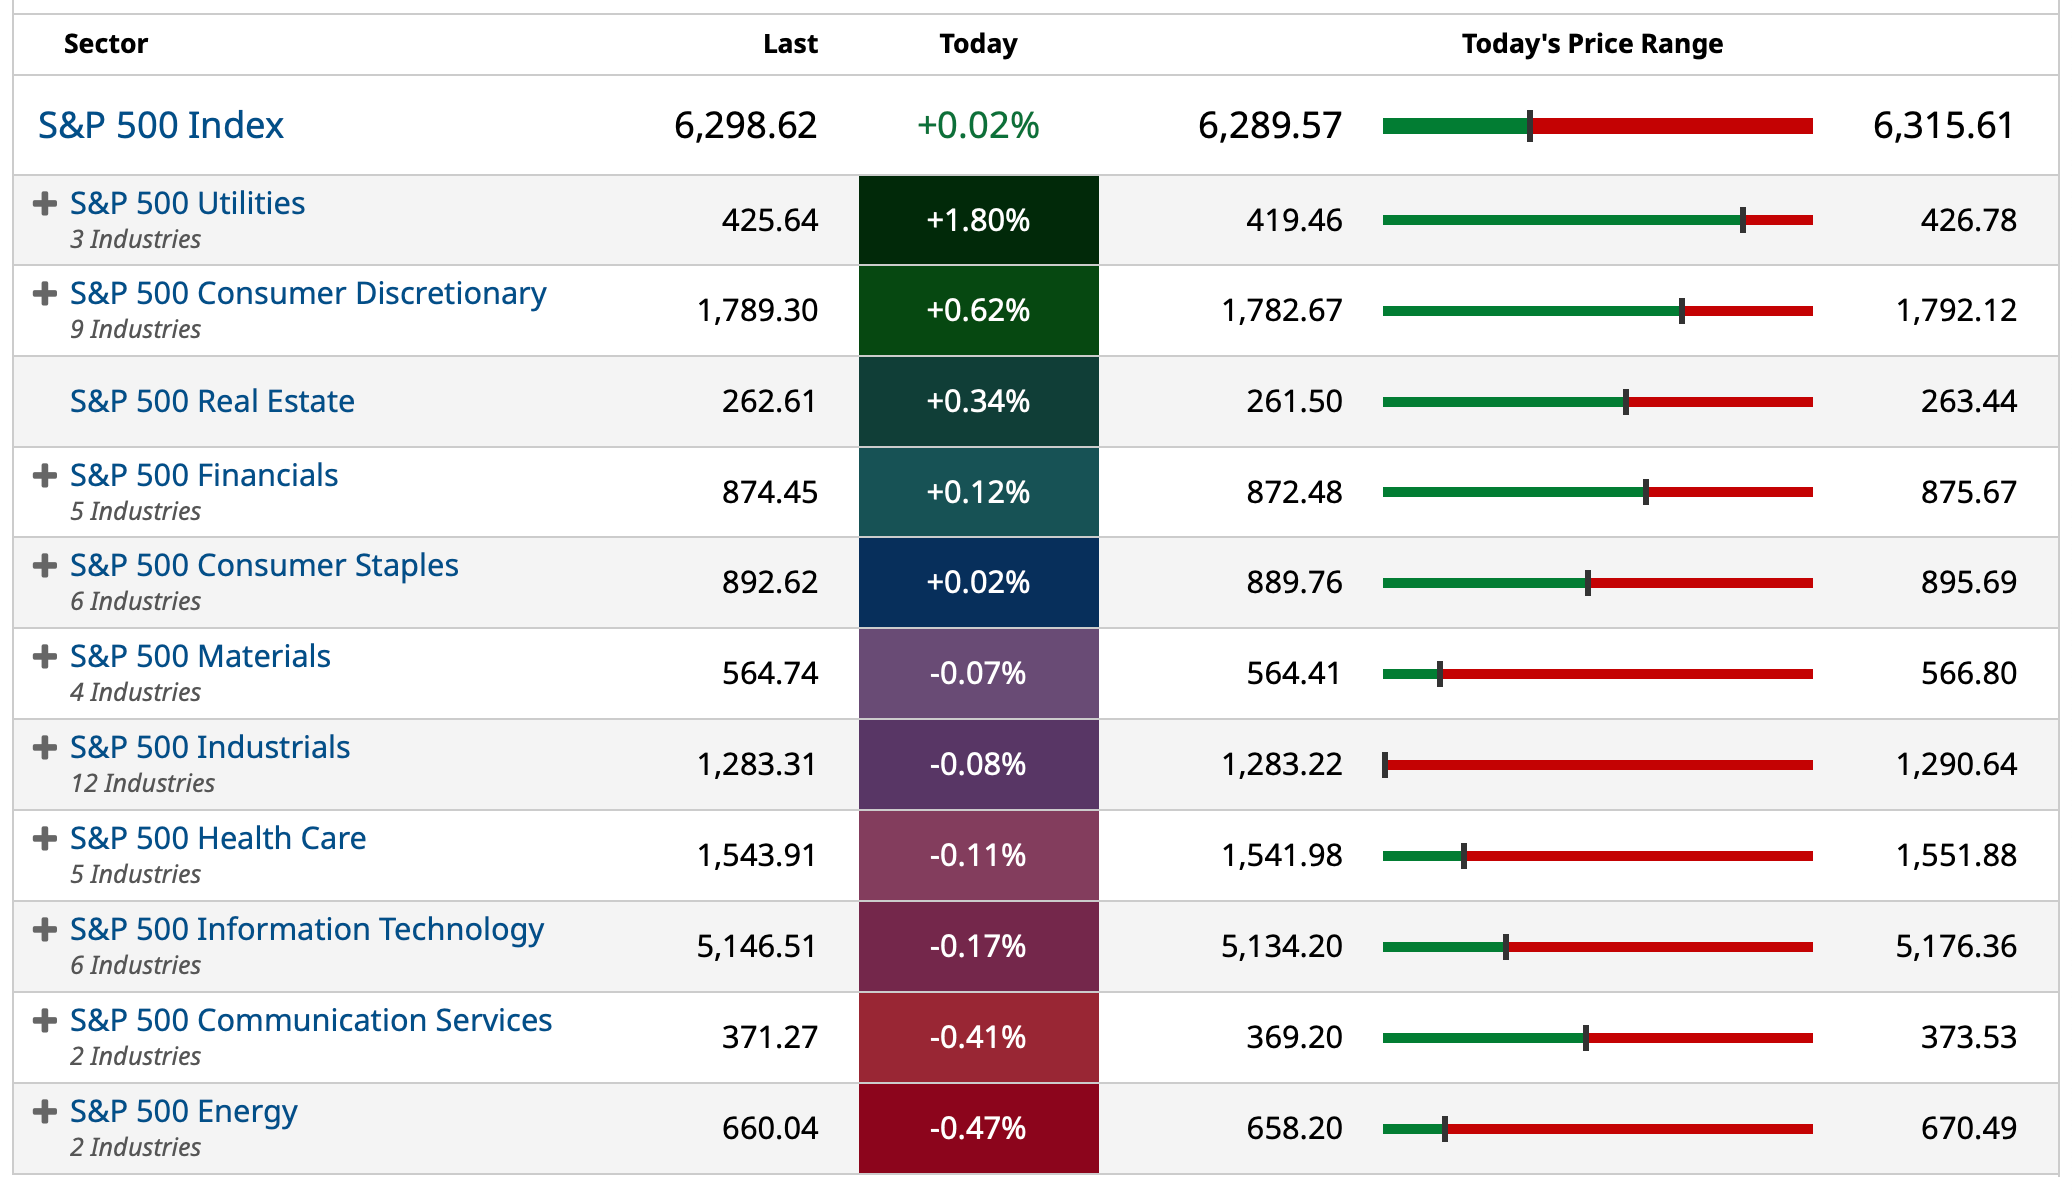
S&P 500 Sectors
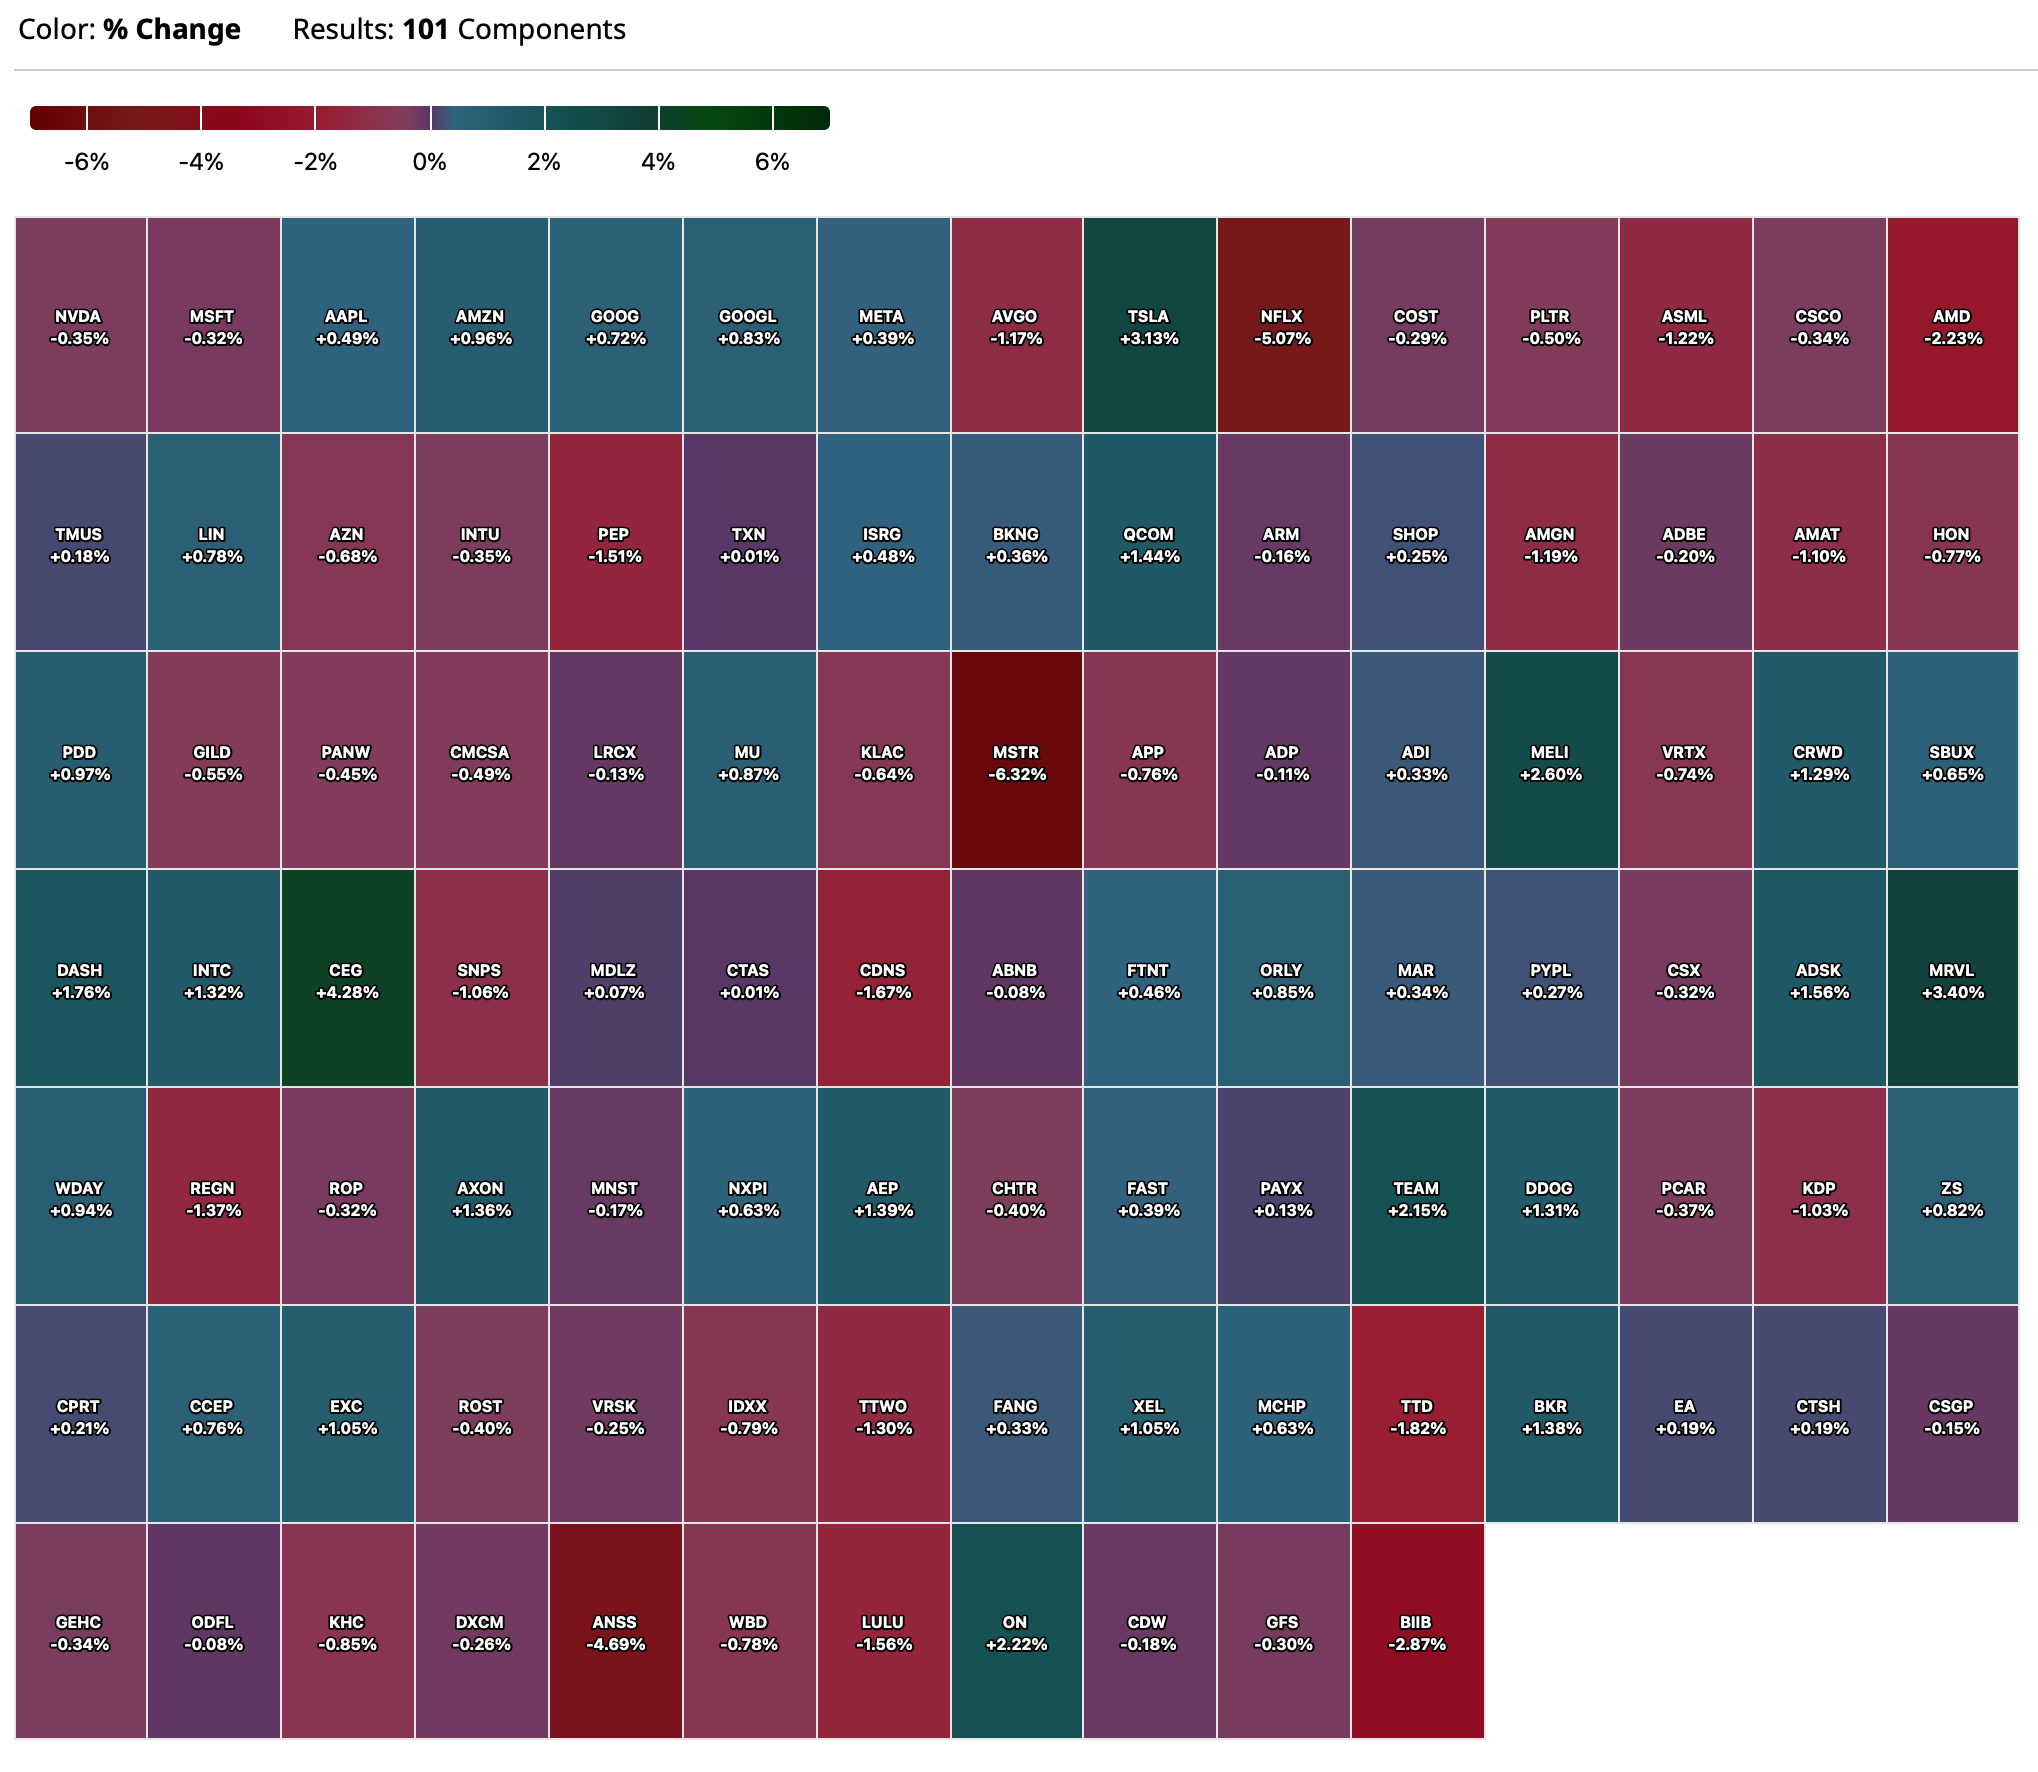
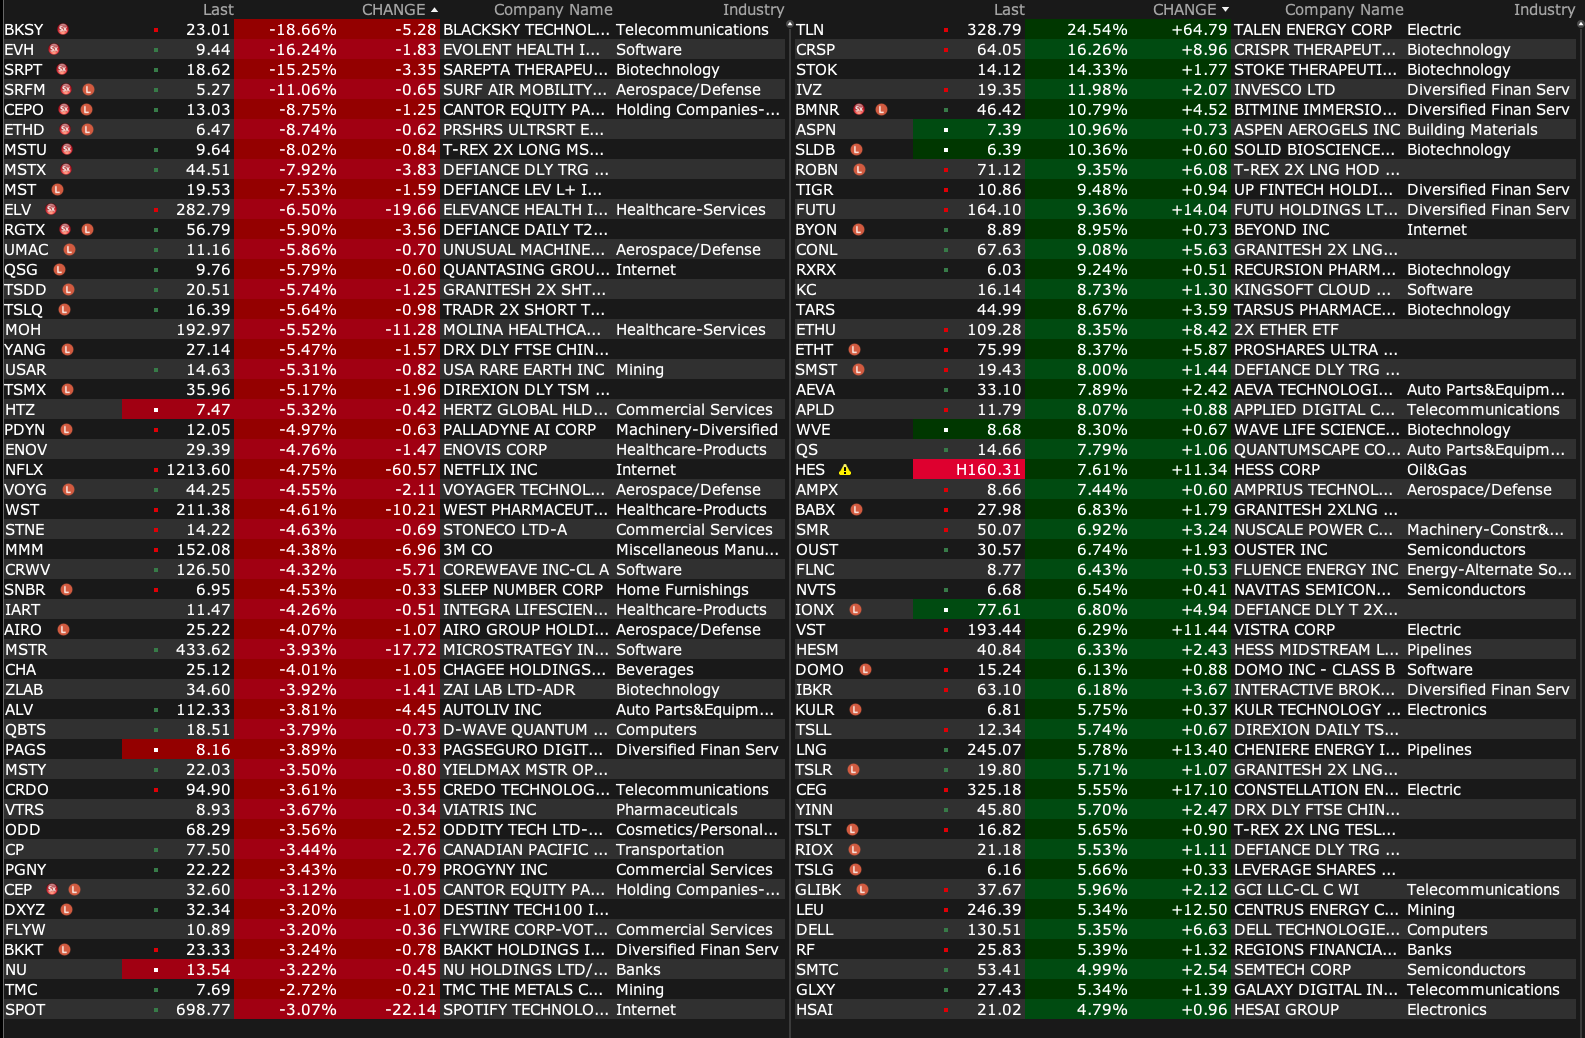
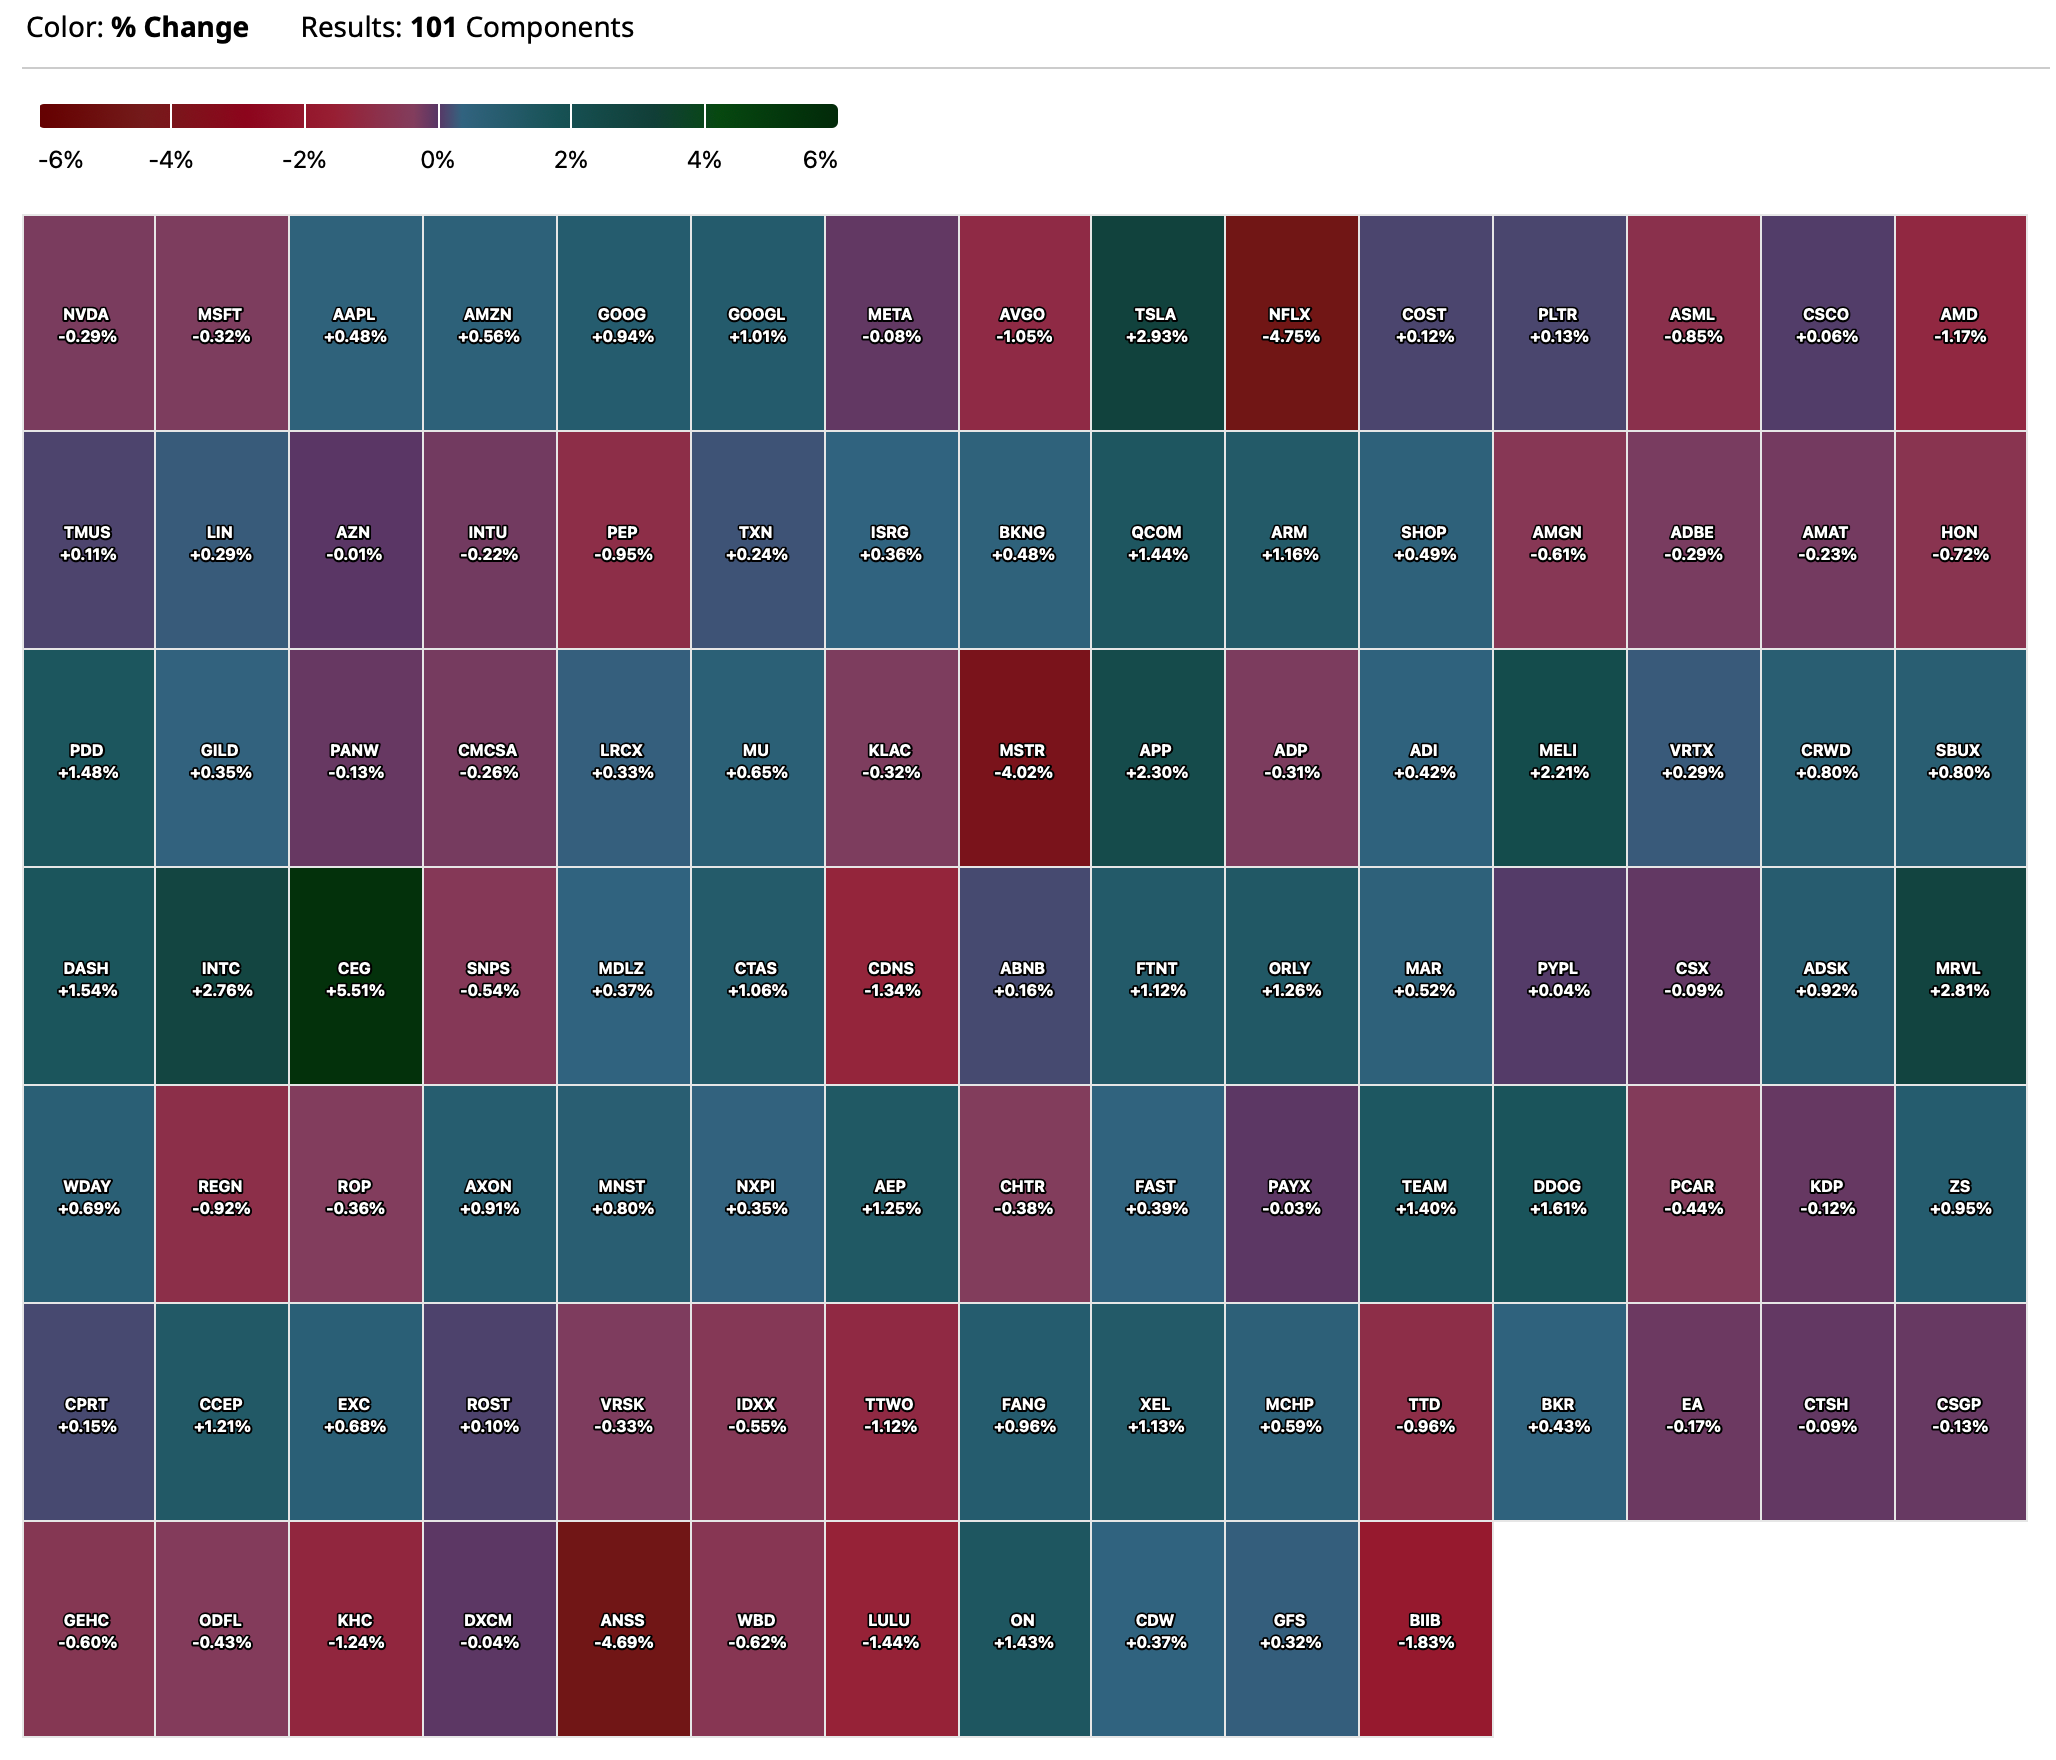
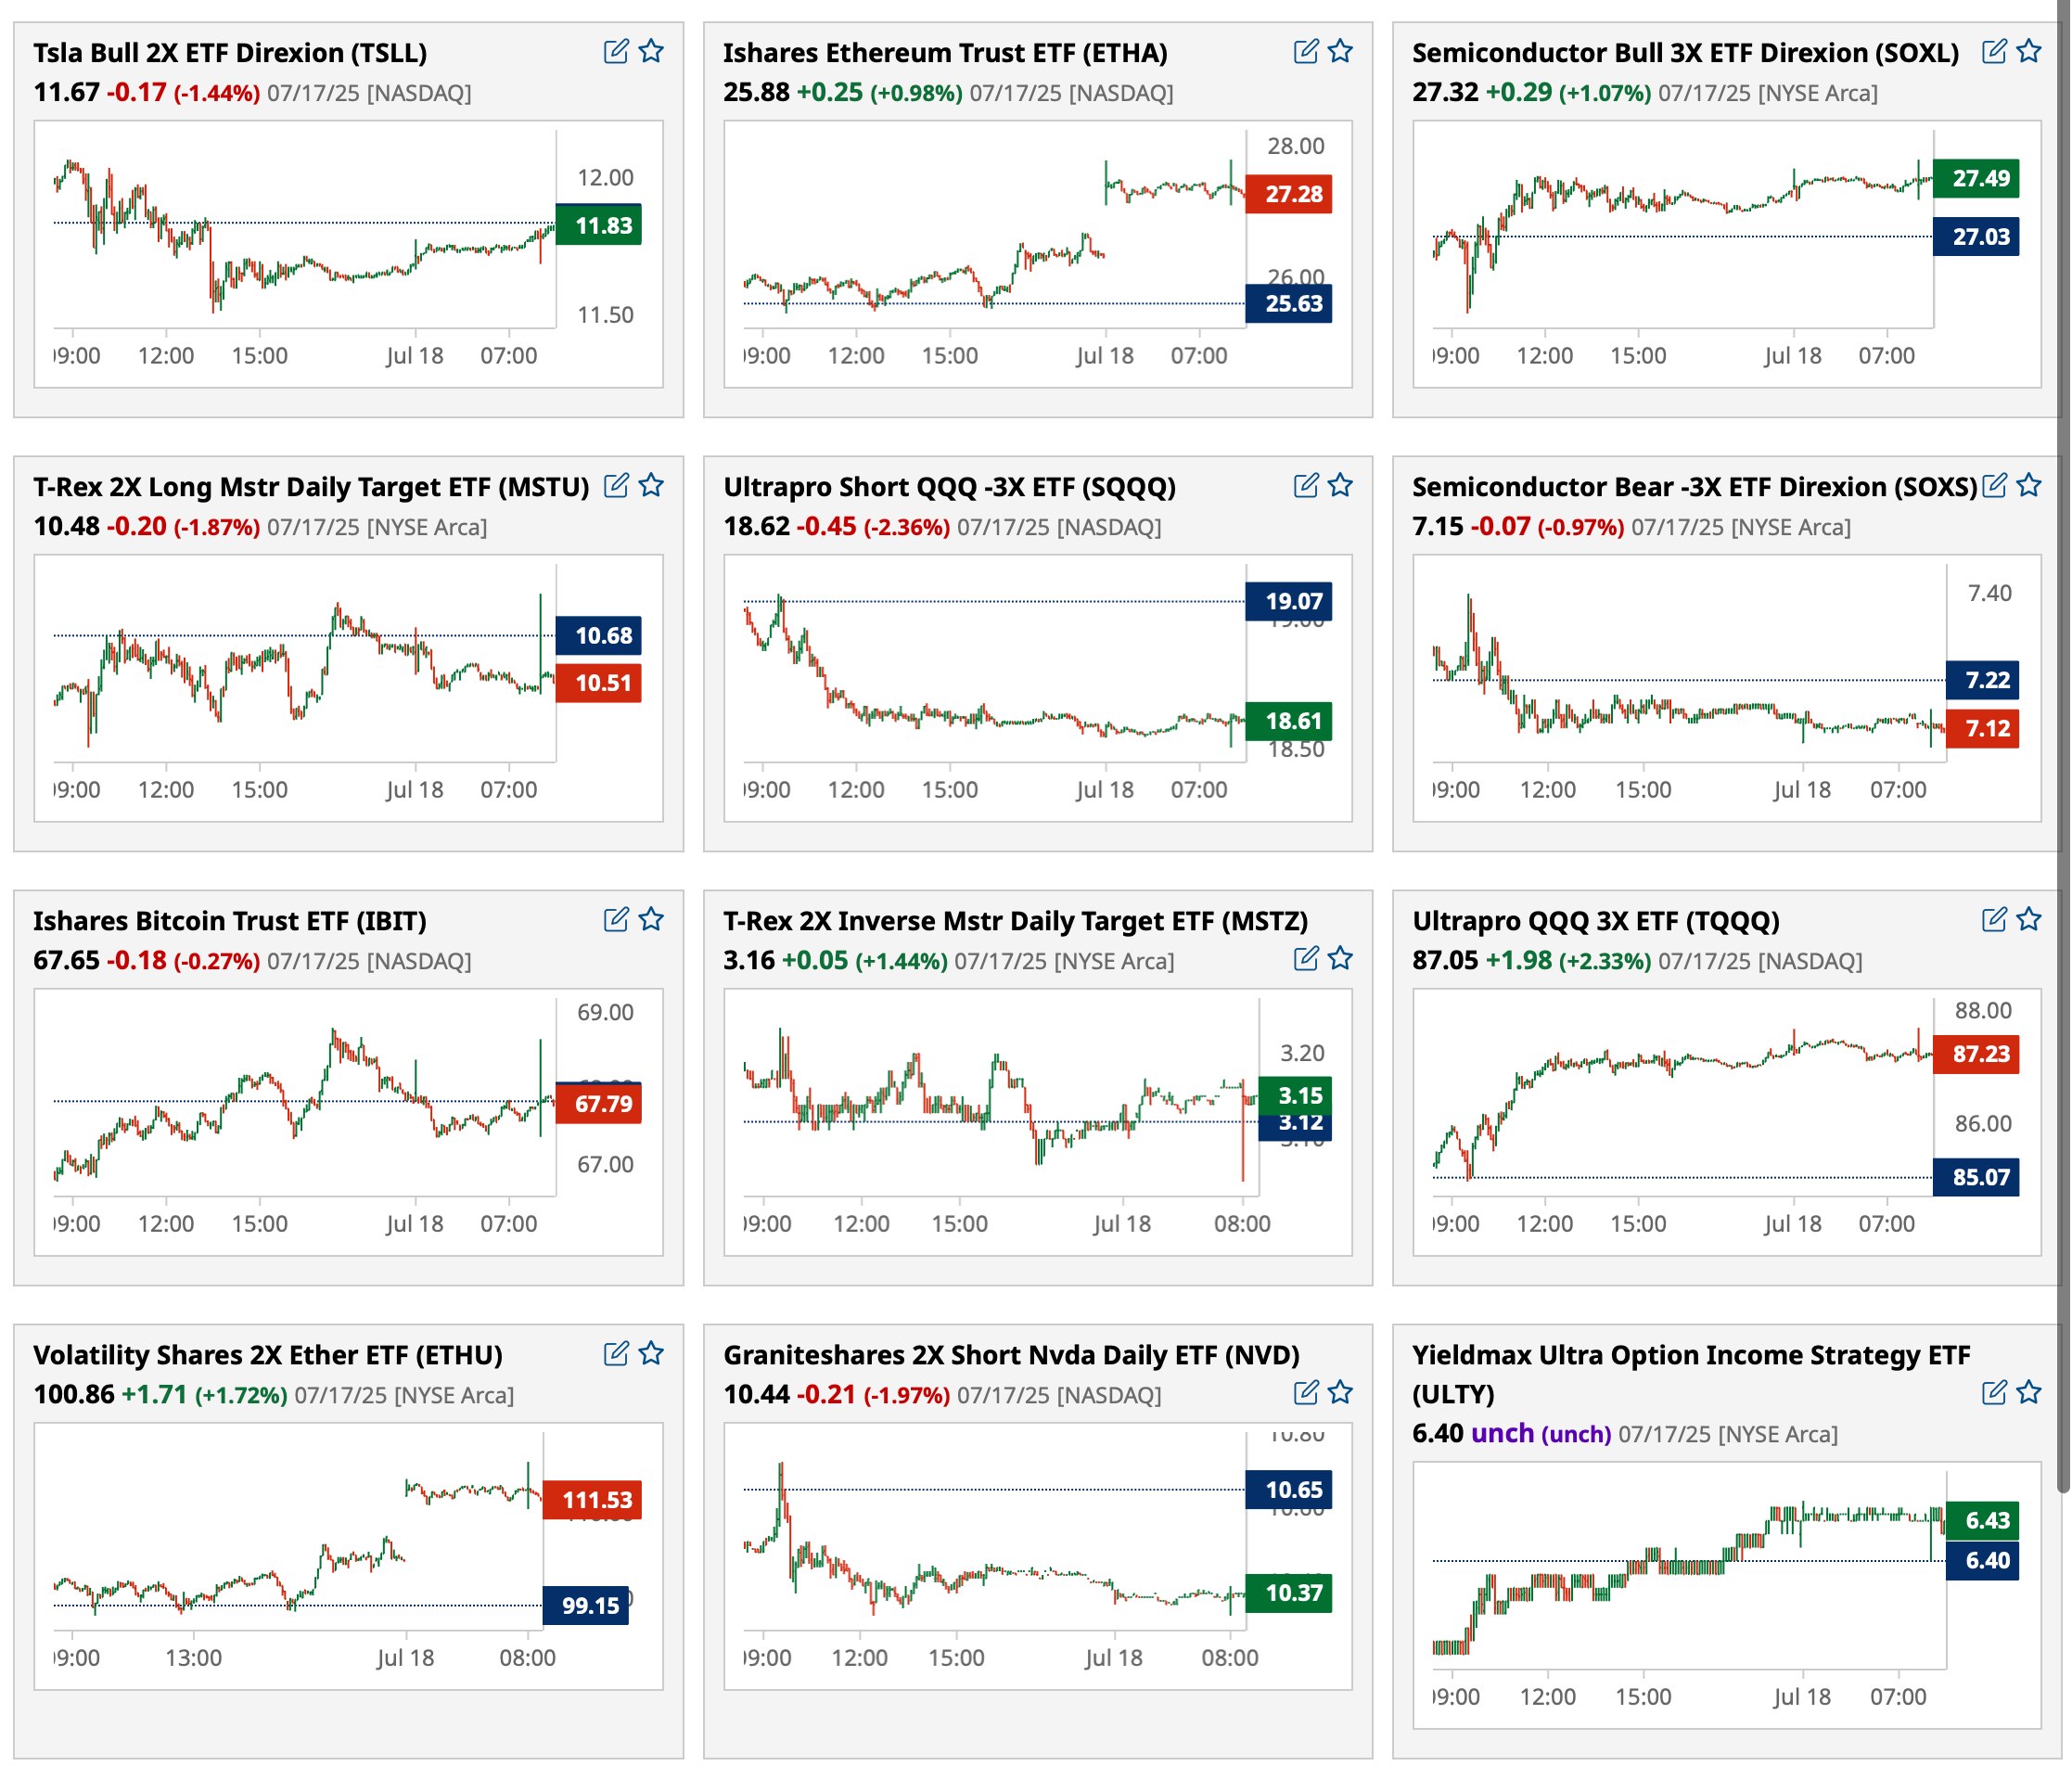
Nasdaq 100 Heat Map
BY Doug Kass · Jul 18, 2025, 4:37 PM EDT
BY Doug Kass · Jul 18, 2025, 4:37 PM EDT
Thanks for reading my Diary today and all week.
Enjoy the weekend.
Be safe.
BY Doug Kass · Jul 18, 2025, 3:45 PM EDT
From Peter Boockvar:
Positives,
1) From the Fed’s Beige Book, it does read like blah economic growth but slightly better than the prior Beige Book. “Economic activity increased slightly from late May through early July. Five Districts reported slight or modest gains, five had flat activity, and the remaining two Districts noted modest declines in activity. That represented an improvement over the previous report, in which half of Districts reported at least slight declines in activity. Uncertainty remained elevated, contributing to ongoing caution by businesses.”
2) Multi family starts rebounded to 438k after the sharp drop in May to 337k from 450k in the month before. Multi family permits rose by 36k m/o/m to 531k which is the most since last November but has been bouncing around the 460k-535k range during this time frame. We’ve seen a huge amount of supply come online over the past year but completions continue to shrink rapidly. In June they totaled 406k vs 502k in May and 648k in January.
3) Initial jobless claims fell to 221k from 228k and that was 12k below expectations. The 4 week average fell to 230k from 236k and smooths out the July 4th holiday influence. Continuing claims were little changed, slipping by 9k to 1956k, just under the most since November 2021.
4) The June CPI rose .3% headline m/o/m and .2% core with the former as expected and the latter one tenth under expectations. The y/o/y gains of 2.7% and 2.9% though compare with 2.4% and 2.8% in the month before and vs the estimates of 2.6% and 2.9%. Energy prices were up .9% m/o/m but down .8% y/o/y. Food prices rose .3% m/o/m and now up 3% y/o/y with ‘food at home’ up .3% m/o/m and 2.4% y/o/y and those out of the home up by .4% m/o/m and 3.8% y/o/y. Services ex energy prices were up by .3% m/o/m and 3.6%. Core goods prices were up by .2% m/o/m and that’s even with declines in both new and used vehicle prices with the former down .3% m/o/m and used car prices lower by .7%.
5) If we take the upward revisions to May PPI, the June wholesale price figures were about as expected. May headline was revised up by 2 tenths to a 3 tenths gain and June saw no change from that vs the estimate of up .2%. The core rate was a touch above expectations as while June was 2 tenths below the forecast, May was revised up by 3 tenths to a .4% increase. The y/o/y gains were 2.3% headline and 2.6% core vs 2.7% and 3.2% in the month before. The component I keep watching for an impact from tariffs is core goods prices, ex food/energy, and they rose .3% m/o/m after a .2% rise in May, and .3% increases in April and March. They are now up 2.5% y/o/y.
6) Import prices, which DO NOT include tariffs in the calculation, rose one tenth m/o/m, two tenths less than expected and May was revised down by 4 tenths. Specifically, import prices ex food/fuels rose .2% m/o/m after a one tenth gain in May (revised down by 3 tenths) and .5% increase in April. The y/o/y gain was 1%.
7) The Philly July manufacturing index rose to +15.9 from -4. The internals were all over the place but were mostly up relative to their 6 month average. The 6 month outlook rose 3.2 pts to 21.5 and is right in line with the half yr outlook. Capital spending plans rose to 17.1 from 14.5 but vs 27 in the month before and +2.0 in the month before that.
8) The July NY manufacturing index jumped to +5.5 from -16 and well better than the estimate of -9.2. The 6 month activity outlook was 24.1 vs 21.2 in the month before.
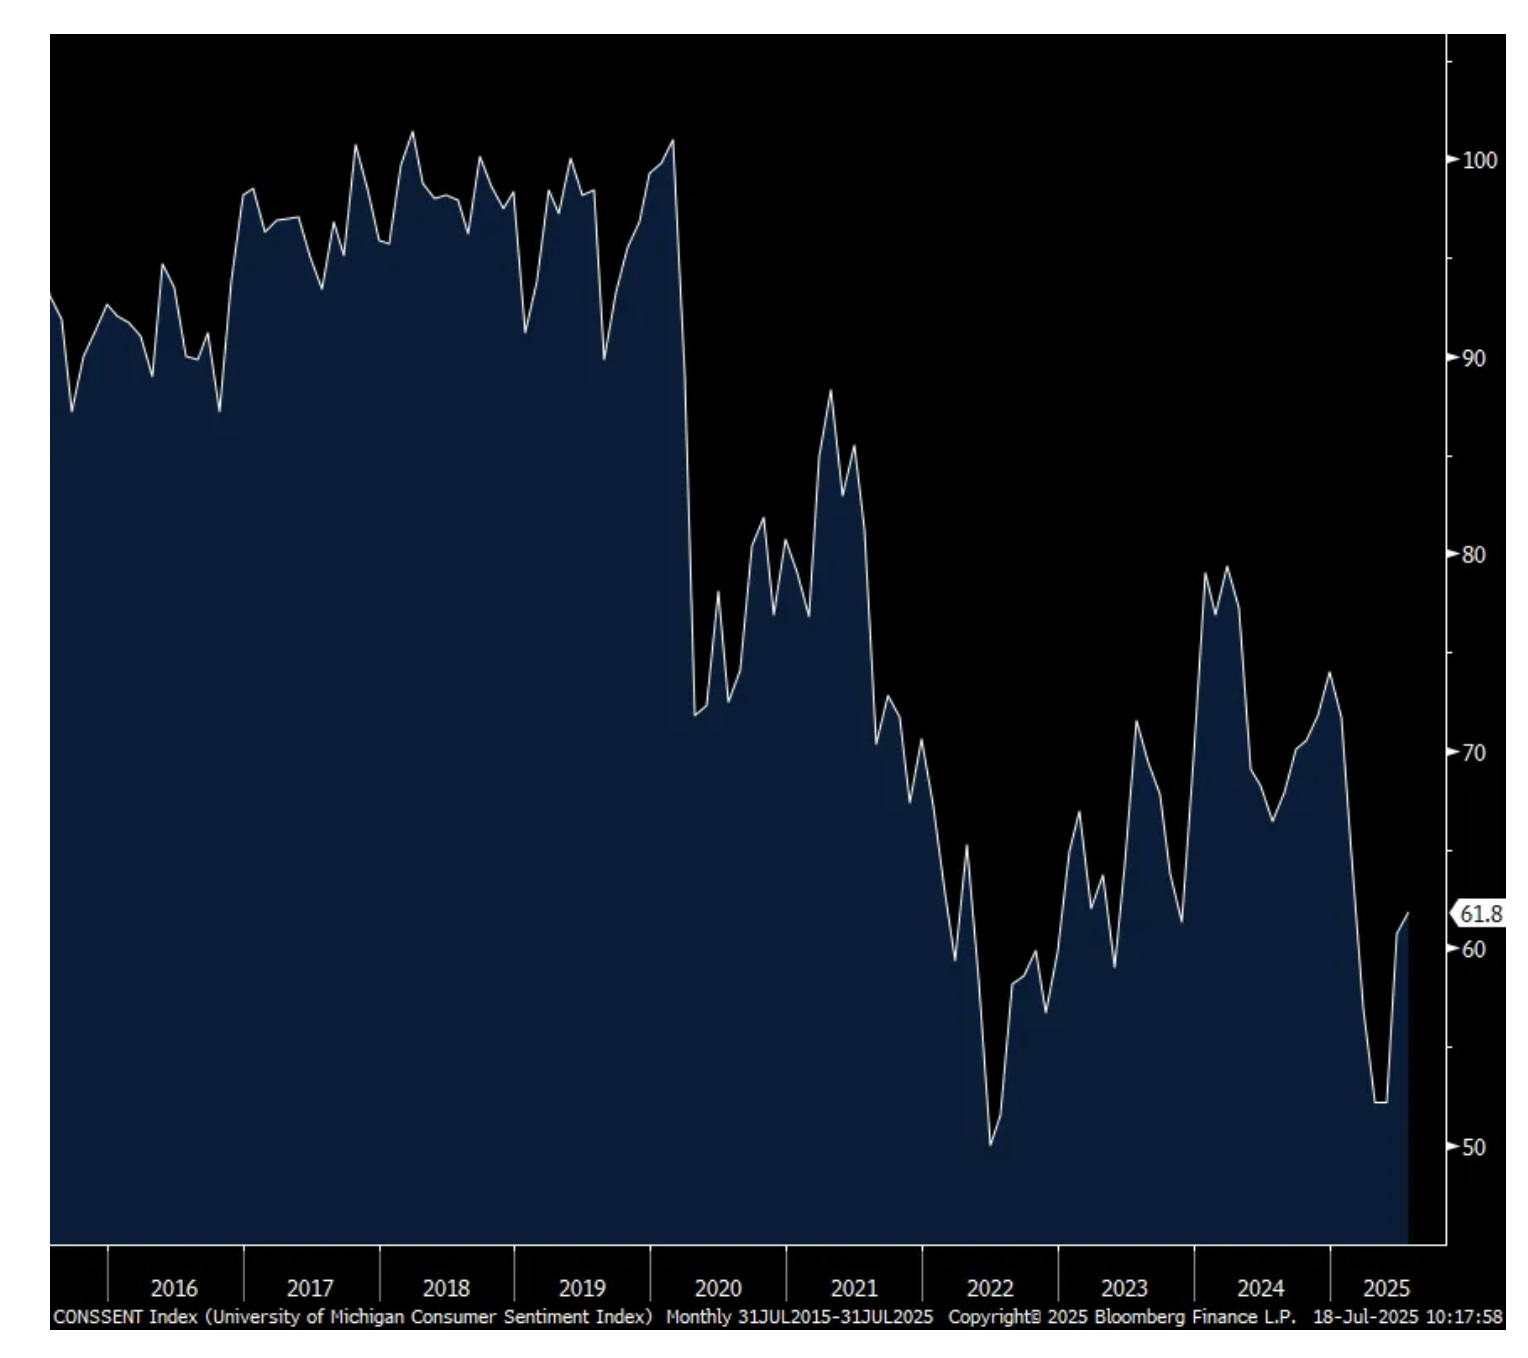
9) The preliminary July UoM consumer confidence index was up slightly, rising by 1.1 pts to 61.8 from 60.7 and about in line with the estimate of 61.5. While the best since February, we entered the year with this index at 74. For further reference, this index was at 101 in February 2020. Current Conditions rose 2 pts m/o/m while the Expectations component was up by .5 pt. Positively, one year inflation expectations fell to 4.4% from 5%, though still up from 2.8% when we started the year. The 5-10 yr inflation guess was 3.6% from 4% in June and compares with 3.0% entering 2025. The UoM said because these two figures remain well above December 2024, “consumers still perceive substantial risk that inflation will increase in the future.” Helping confidence here too continues to be rising stock prices “with sentiment gains among stock market participants. However, those without stock wealth experienced a sentiment decline.” The UoM said, “for non-stockholders, sentiment is at virtually the same low level as last year.” The bottom line from the UoM, “Sentiment trends this year have been driven by the evolution of concerns over tariffs, primarily due to concerns that trade policy could worsen the prices consumers face. Moreover, consumers’ expectations over business conditions, labor markets, and even their own incomes continue to be weaker than a year ago. That said, the recent two month lift in sentiment suggests that consumers believe that the risk of the worst case scenarios they expected in April and May has eased, given the slowdown of trade policy developments thereafter.”
10) When including the May revision, core retail sales were exactly as expected with a .5% m/o/m gain in June following a .2% rise in May. The pull forward activity in auto purchases has disrupted this line item. Sales of vehicles/parts rose 1.2% after ups and downs in the prior months. Building material sales were up .9% m/o/m but after falling by 2.7% in the month before. The caveat, on a y/o/y basis, core retail sales were up 4% and for perspective, that matches the slowest rate of increase since August 2024.
11) June US industrial production rose .3% m/o/m, two tenths more than expected and May was revised up by two tenths. The manufacturing component saw a one tenth rise after a .3% gain in May.
12) After selling seen in April, foreigners stepped up their purchases of US Treasuries in May with most of the buying from the private sector which added $119.6b of buying while the 'official' side bought a net $27b. What was most interesting was the behavior of Canada. Canada sold $58b of US notes and bonds in April, the biggest one month amount on record but bought back $61.7b in May. China continues to reduce its holdings while there was little change in the amount Japan owns. Foreigners also bought about $100b worth of US stocks.
13) From Bank America: “We continue to see solid consumer spending data…improving credit quality…plenty of household net worth growth in the market growth, and also the account balances, again, staying strong above where they were pre-pandemic.” Also, “We see solid commercial loan growth, and we see good credit quality with the exception of CRE in office…But we also see our clients continue to see clarity with the changes in trade and tariffs, and now with the tax bill passing, we can see them start to understand the future and expect them to behave accordingly.”
14) From JP Morgan: Dimon said "we continue to struggle to see signs of weakness...the consumer basically seems to be fine. Now, few things are true. Like, if you look at indicators of stress, not surprisingly, you see a little bit more stress in the lower income bands than you see in the higher income bands, but that's always true. That's pretty much definitionally true, and nothing out of line with our expectations." Also, "Our delinquency rates are also in line with expectations. You saw that we kept our net charge-off guidance unchanged. So, all of that looks kind of fine, and, to be honest, as we've said before, fundamentally, while there are nuances around the edges, consumer credit is primarily about labor markets, and in a world with 4.1% unemployment rate, it's just going to be hard, especially in our portfolio, to see a lot of weakness."
15) From Citigroup: "Now let's turn to the environment. Well, it's proven to be more resilient than most of us anticipated, but we aren't dropping our guard as we begin the second half of the year. We expect to see goods prices start ticking up over the summer as tariffs take effect, and we have seen pauses in CapEx and hiring amongst our client base. All of that said, the strength of the US economy, driven by the American entrepreneur and a healthy consumer, has certainly been exceeding expectations of late. As I've been speaking to CEOs, I've yet again been impressed by the adaptability of our private sector, aided by the depth and breadth of the American capital markets."
16) From Wells Fargo: "As we look ahead, what we see regarding the health of our clients and customers has not changed. Consumers and businesses remain strong, as unemployment remains low, and inflation remains in check. Credit card spending growth softened very slightly in the second quarter, but it's still up y/o/y, and remains strong overall. And debit card spending growth has remained strong and consistent with what we saw in prior quarters." Also, "Consumer delinquencies continue to improve from a year ago, and commercial credit performance continued to be relatively strong. Deposit flows for both our consumer and commercial clients were in line with seasonal trends."
17) From Manpower: “When we last reported our Q1 results in April, we spoke at a time of heightened uncertainty, particularly surrounding trade negotiations and their potential impact on the global economy. At that point, many organizations were choosing to pause or slow hiring plans as they waited for greater clarity. Since then, we’ve seen some of this uncertainty begin to ease. Employers facing not only macroeconomic complexity but also continued geopolitical tensions are proving resilient. What might once have been seen as black swan moments are now being absorbed with greater pragmatism and pace.” Further, “Our most recent Manpower Group Employment Outlook Survey of more than 40,000 employers across 42 countries also supports this view. The global hiring outlook is holding steady, up very slightly y/o/y and just one point lower than last quarter. The picture continues to be mixed globally though, with Latin America and Asia Pacific labor markets performing well. While we see cooling yet resilient hiring intent in North America. In Europe, employers continue to be more cautious, particularly in Northern Europe, reflecting its greater exposure to economic and geopolitical headwinds.” I bolded to highlight.
18) From Pepsi: "In North America, despite subdued category demand, we were encouraged to see an improvement in organic volume trends for our convenient foods business as the quarter progressed - with an improvement in our market share in key subcategories as we stepped up commercial activities by offering good value to consumers, more focused innovation activity, and heightened in-market execution."
19) From Fifth Third Bank: "In a quarter where uneven C&I loan demand and a soft housing market made loan growth tepid for the industry, our diversified loan origination platforms produced average loan growth of 5% over the prior year. We grew loans in C&I, CRE, leasing, mortgage, home equity, auto, and both our Provide and dividend fintech platforms…Broad based credit trends remain stable across industries and geographies, despite the market and economic volatility."
20) From United Airlines: "Beginning in early July, United has seen a sequential 6 point acceleration in demand and a double-digit acceleration in business demand vs the second quarter. The airline attributes this to less geopolitical and macroeconomic uncertainty."
21) From Burberry: "In Q1, we saw reduced activity by tourists globally and traffic remained challenged. That said, in Americas, we experienced 4% growth, supported by new local customer growth.”
22) From Alcoa: "From a demand perspective, conditions remain steady in both Europe and North America, although sector performance is mixed. Electrical and Packaging continue to perform well. Construction appears to be stabilizing and Automotive remains the most affected by tariff related uncertainty. In China, easing trade tensions with the US are providing a modest boost to demand…On the supply side, growth was limited in the second quarter with only marginal increases from smelter restarts and expansions. Global production remains constrained, particularly outside of China."
23) The China trade data for June was a bit above expectations with exports up 5.8% y/o/y vs the estimate of up 5%. Imports, many of which end up in eventual exports, grew by 1.1% y/o/y vs the forecast of up .3%. Exports to the US specifically dropped 16% after plunging by 34% in May. Exports in contrast were up by 17% to Southeast Asia.
Negatives,
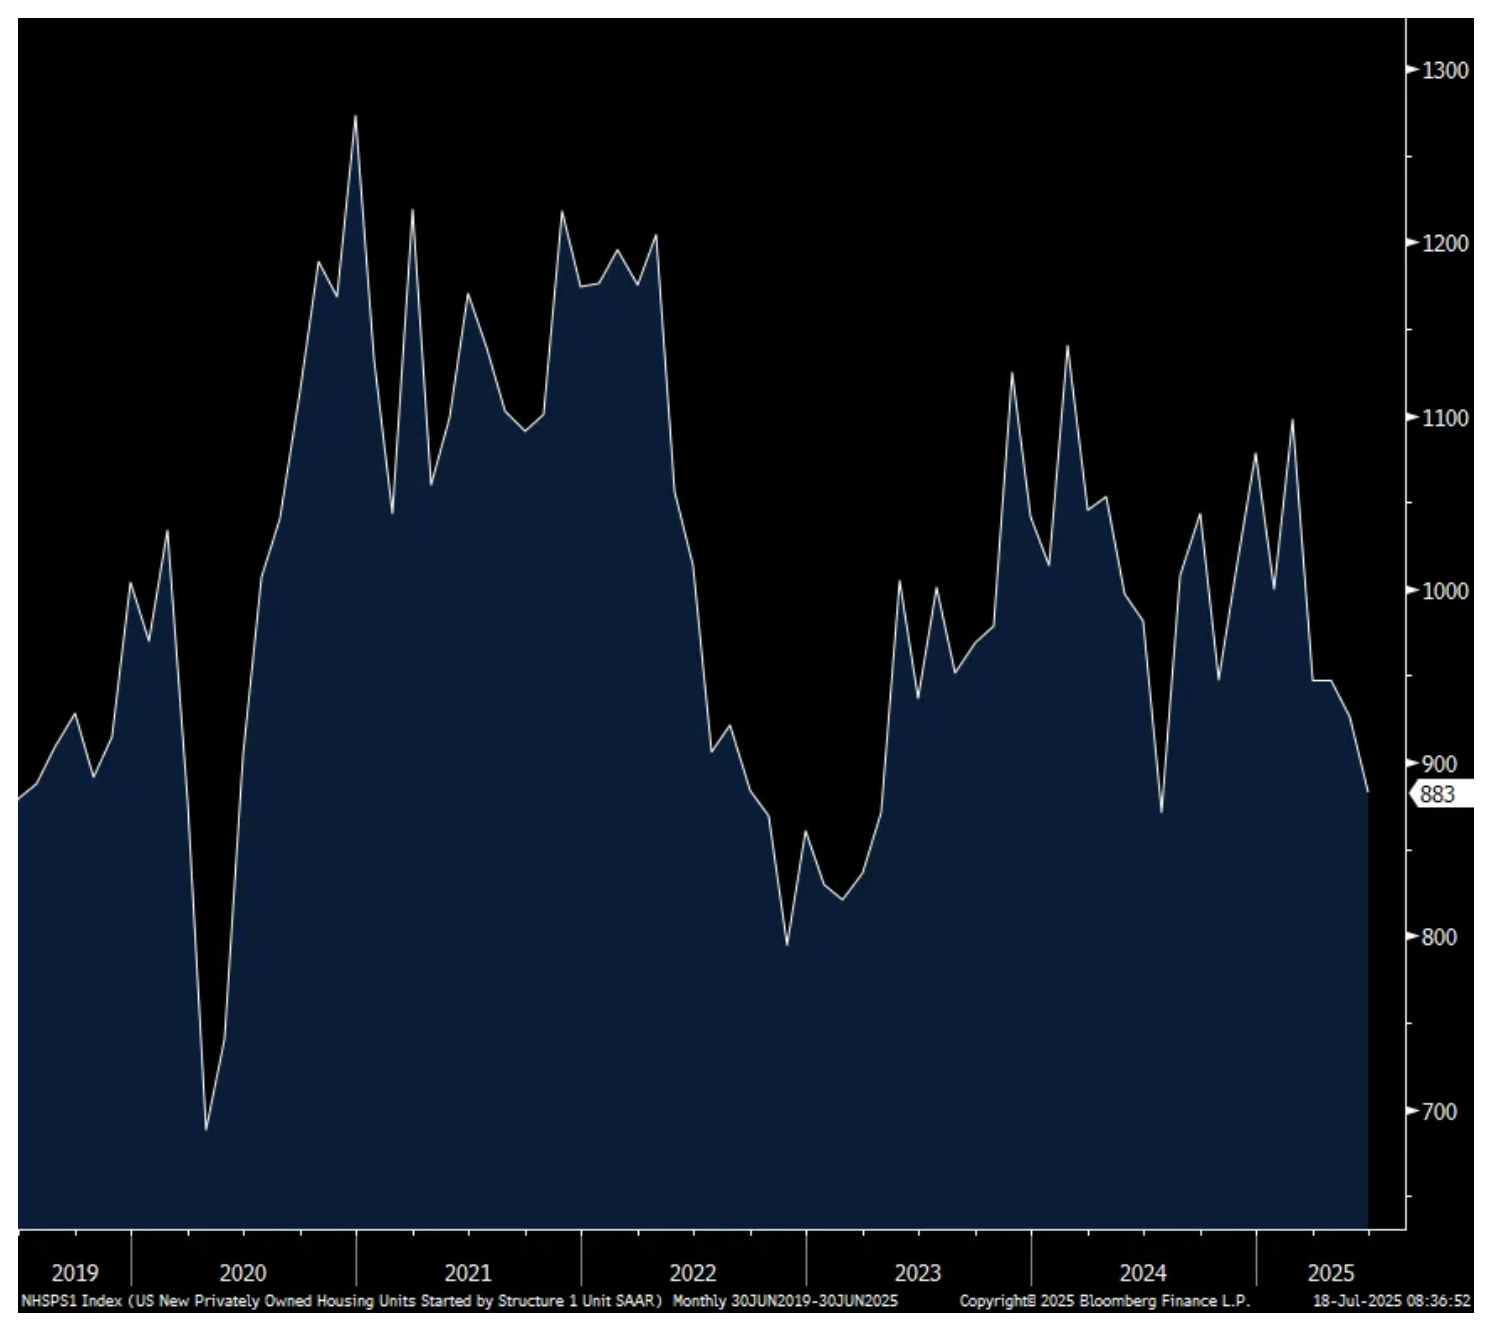
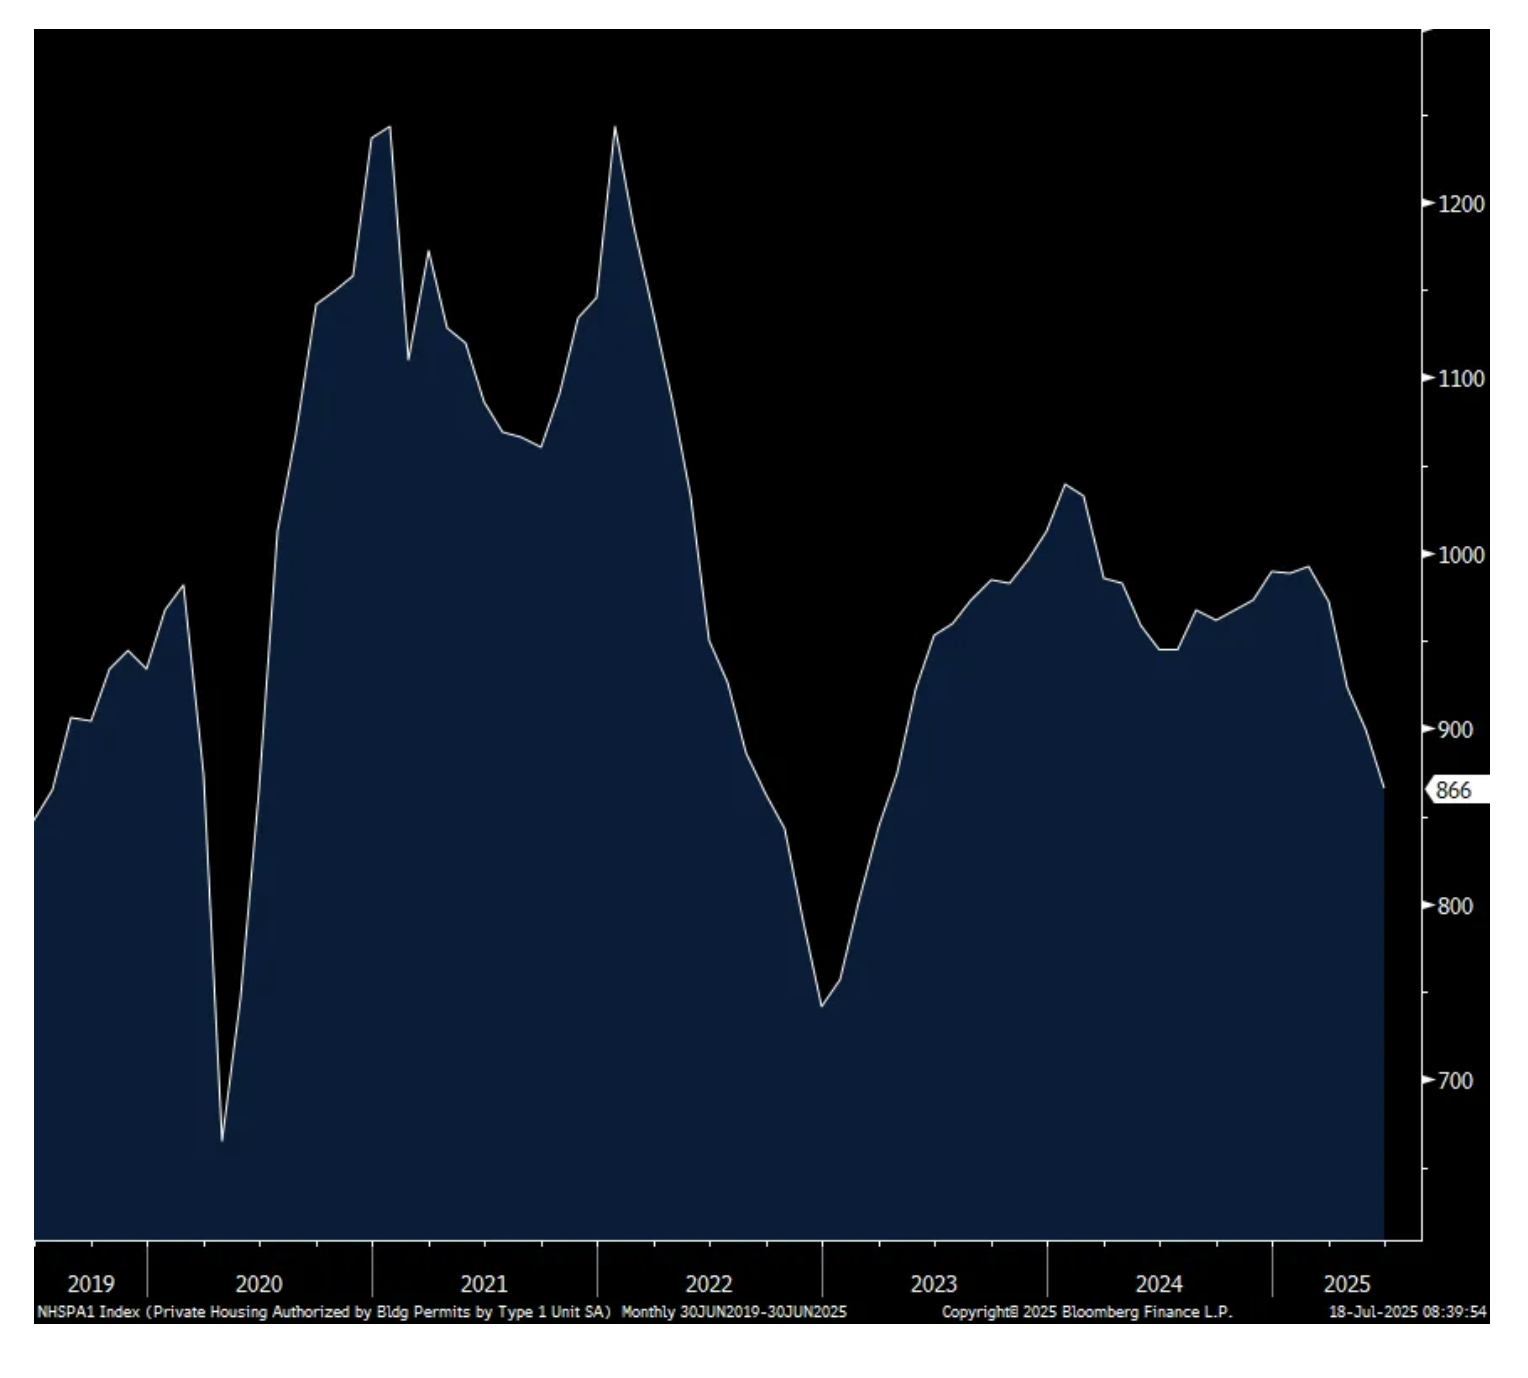
1) Single family housing starts fell to the least since July 2024 at 883k annualized. Permits for single family construction fell by 33k m/o/m to 866k, the lowest since March 2023.
2) The NAHB July home builder sentiment survey remained depressed at 33 vs 32 in the May. Prospective Buyers Traffic was just 20, 30 pts below the breakeven and down another 1 pt m/o/m. The NAHB said “the latest HMI survey also revealed that 38% of builders reported cutting prices in July, the highest percentage since NAHB began tracking this figure on a monthly basis in 2022. This compares with 37% of builders who reported cutting prices in June, 34% in May and 29% in April. Meanwhile, the average price reduction was 5% in July, the same as it’s been every month since last November. The use of sales incentives was 62% in July, unchanged from June.”
3) Reflecting the ups and downs of orders in response to the on and off tariffs, the June Cass Freight Index was flattish from May with a .2% slight decline. They are though still down 2.4% y/o/y. Cass said "The trade war is having a variety of effects, with a few waves of pre-tariff inventory building and subsequent drawing down, but volumes were steady from May." The bottom line from Cass, "Forward-looking visibility remains highly dependent on policy developments and legal challenges. The uncertainty has lowered the economic outlook, and pre-tariff inventory building will lead to destocking regardless of the outcome of trade negotiations in the coming months. The effects of tariffs may worsen, as higher goods prices reduce affordability and real incomes. With this outlook, the cycle upturn for the transportation industry remains elusive."
4) The NY July services index remained negative at -9.3 vs -13.2 in the month before. That’s the 10th month in a row of a NY regional services contraction.
5) From Fastenal: "And when I think about the growth this quarter, market conditions, they haven't really helped us and remained sluggish…supply chains have gotten more expensive, and a part of our response over time will be incremental pricing...During the second quarter, we implemented three separate pricing actions, which aim to contribute 3% to 4% of price by the end of the second quarter of 2025. The phased approach to this rollout resulted in 140 bps to 170 bps of additional impact in the second quarter, with momentum building as we ended the quarter. Additional pricing actions will be necessary in the second half of 2025, with the potential to double the impact of pricing, depending upon where the deferred tariffs ultimately settle and the pace and execution of our actions."
6) From Snap On Tools: "the macro environment is still turbulent…the tech uncertainty has stabilized. And having said that, it remains significant."
7) From BASF: "Due to ongoing macroeconomic and geopolitical uncertainties, BASF is adjusting its assumptions for the full year 2025. The global gross domestic product is projected to grow less in 2025 than previously assumed. This development is essentially attributable to the US tariffs announced in early April and the resulting uncertainties in the market. Against this background, the US dollar has depreciated significantly against the euro. The growth of global industrial production is also expected to slow down. As a result, in 2025, market demand for chemical products will likely grow less than previously expected. Due to continued high product availability on the market, margins continue to remain under pressure, especially upstream."
8) From Alcoa: "With the increase in the US Section 232 tariff rate from 25% to 50%, we expect quarterly tariff costs to approximate $215 million based on an LME of $2,600 and a Midwest premium of $.67 per pound."
9) From JB Hunt: "While we continue to focus on operational excellence, driving productivity, and managing our costs, inflationary pressures, primarily in wages, insurance, both casualty and medical, and equipment costs, more than offset those efforts and weighed on margins vs the prior year period." Also, "During the quarter, overall customer demand trended modestly below normal seasonality. As customers adapted to changes in global trade policy, the timing and direction of freight flows were impacted. That said, demand for our intermodal service remained strong. We continue to see customers convert more freight to intermodal from the highway."
10) From Albertson’s: "we continue to see the customers seeking value. We're selling more on promotion. That's been happening for quite some time now. We're leaning heavily into owned brands, understanding that…As I think about the customer, we were looking at some category information and it's been interesting, some of our top performing categories in the first quarter, it was kind of a tale of two cities. We absolutely saw increases in the shift into pork and ground beef as one example, again, indicating that the customer is looking for value. We also saw strong growth in our deli chicken business as an example, knowing that I think customers are always looking for quick and easy meal solutions. And with the increase of food away from home, I think inflation was almost 4%, we're absolutely providing value there."
11) From ASML: "We continue to see increasing uncertainty driven by macro economic and geopolitical developments. Therefore, while we still prepare for growth in 2026, we cannot confirm it at this stage. With tariffs, "Customers are watching that landscape but are currently faced with that uncertainty. As soon as that becomes clearer, then also their investment plans will become clearer."
12) Japan's core/core inflation in June reported today rose 3.4% y/o/y, one tenth more than expected.
13) Japan said its June exports fell .5% y/o/y vs the estimate of a gain of .5%. Specifically, car and steel exports were down, likely tariff influenced with total exports to the US down by 11.4% y/o/y. This though was partly due to Japanese exporters absorbing some of the tariffs as the amount of cars exported to the US rose y/o/y. That said, a few weeks ago stories started to come out that Japanese automakers were done absorbing costs and were going to start raising prices.
14) The June unemployment rate in Australia rose to 4.3% from 4.1% and that is the highest since November 2021.
15) The UK labor market was soft again in June with a drop in 'payrolled employees' of 41k vs the estimate of -35k. The positive was that while May was negative too, it was less so with an upward revision of 84k to -25k. Their unemployment rate thru May rose to 4.7% from 4.6% and that is the highest since June 2021. Weekly earnings ex bonus remained strong, rising by 5% y/o/y.
16) UK June CPI surprised to the upside with a headline gain of 3.6% y/o/y vs the estimate of 3.4% and up from 3.4% in May. The core rate also exceeded expectations by two tenths in a 3.7% rise y/o/y. A 4.4% jump in food prices was a factor for the headline and also higher payroll taxes and minimum wage increases flowed into higher consumer prices. Services inflation rose 4.7% y/o/y, the same pace seen in May.
BY Doug Kass · Jul 18, 2025, 3:15 PM EDT
Here are today's "things:"
* I added to my (short) speculative package.
* I covered my RSP short at $184.61.
* Shorted more index calls, sold my index puts.
* Added to my Tesla TSLA short at $327.50.
BY Doug Kass · Jul 18, 2025, 2:07 PM EDT
Dan Nathan interviews Dan Niles in an excellent interview.
BY Doug Kass · Jul 18, 2025, 1:10 PM EDT
With S&P cash -9 handles I am taking in my index puts.
While I did make some $s on today's purchase (I lost on the first buys).
The puts were initially in the money and as the market ramped they went out of the money.
I put the proceeds back into short index calls position.
BY Doug Kass · Jul 18, 2025, 12:53 PM EDT
From Peter Boockvar:
Home sales data/Consumer confidence dependent on whether one owns stocks or not
Single family housing starts fell to the least since July 2024 at 883k annualized. Multi family starts rebounded to 438k after the sharp drop in May to 337k from 450k in the month before. This component tends to be very volatile month to month.
Permits for single family saw no light at the end of the tunnel either as they fell by 33k m/o/m to 866, the lowest since March 2023. Multi family permits rose by 36k m/o/m to 531k which is the most since last November but has been bouncing around the 460k-535k range during this time frame.
I want to add this on multi family. We’ve seen a huge amount of supply come online over the past year but completions continue to shrink rapidly. In June they totaled 406k vs 502k in May and 648k in January. I’ll argue again, we’re sowing the seeds for an eventual re-acceleration in rent growth in the back half of next year, especially if buying a home continues to be tough for many first time buyers.
Bottom line, affordability is certainly the big issue for single family home buying and from the construction standpoint, also is the rise in costs. In yesterday’s July NAHB builder sentiment survey, builders are increasing their incentives to move product. They said “the latest HMI survey also revealed that 38% of builders reported cutting prices in July, the highest percentage since NAHB began tracking this figure on a monthly basis in 2022. This compares with 37% of builders who reported cutting prices in June, 34% in May and 29% in April. Meanwhile, the average price reduction was 5% in July, the same as it’s been every month since last November. The use of sales incentives was 62% in July, unchanged from June.”
Single Family Starts
Single Family Permits
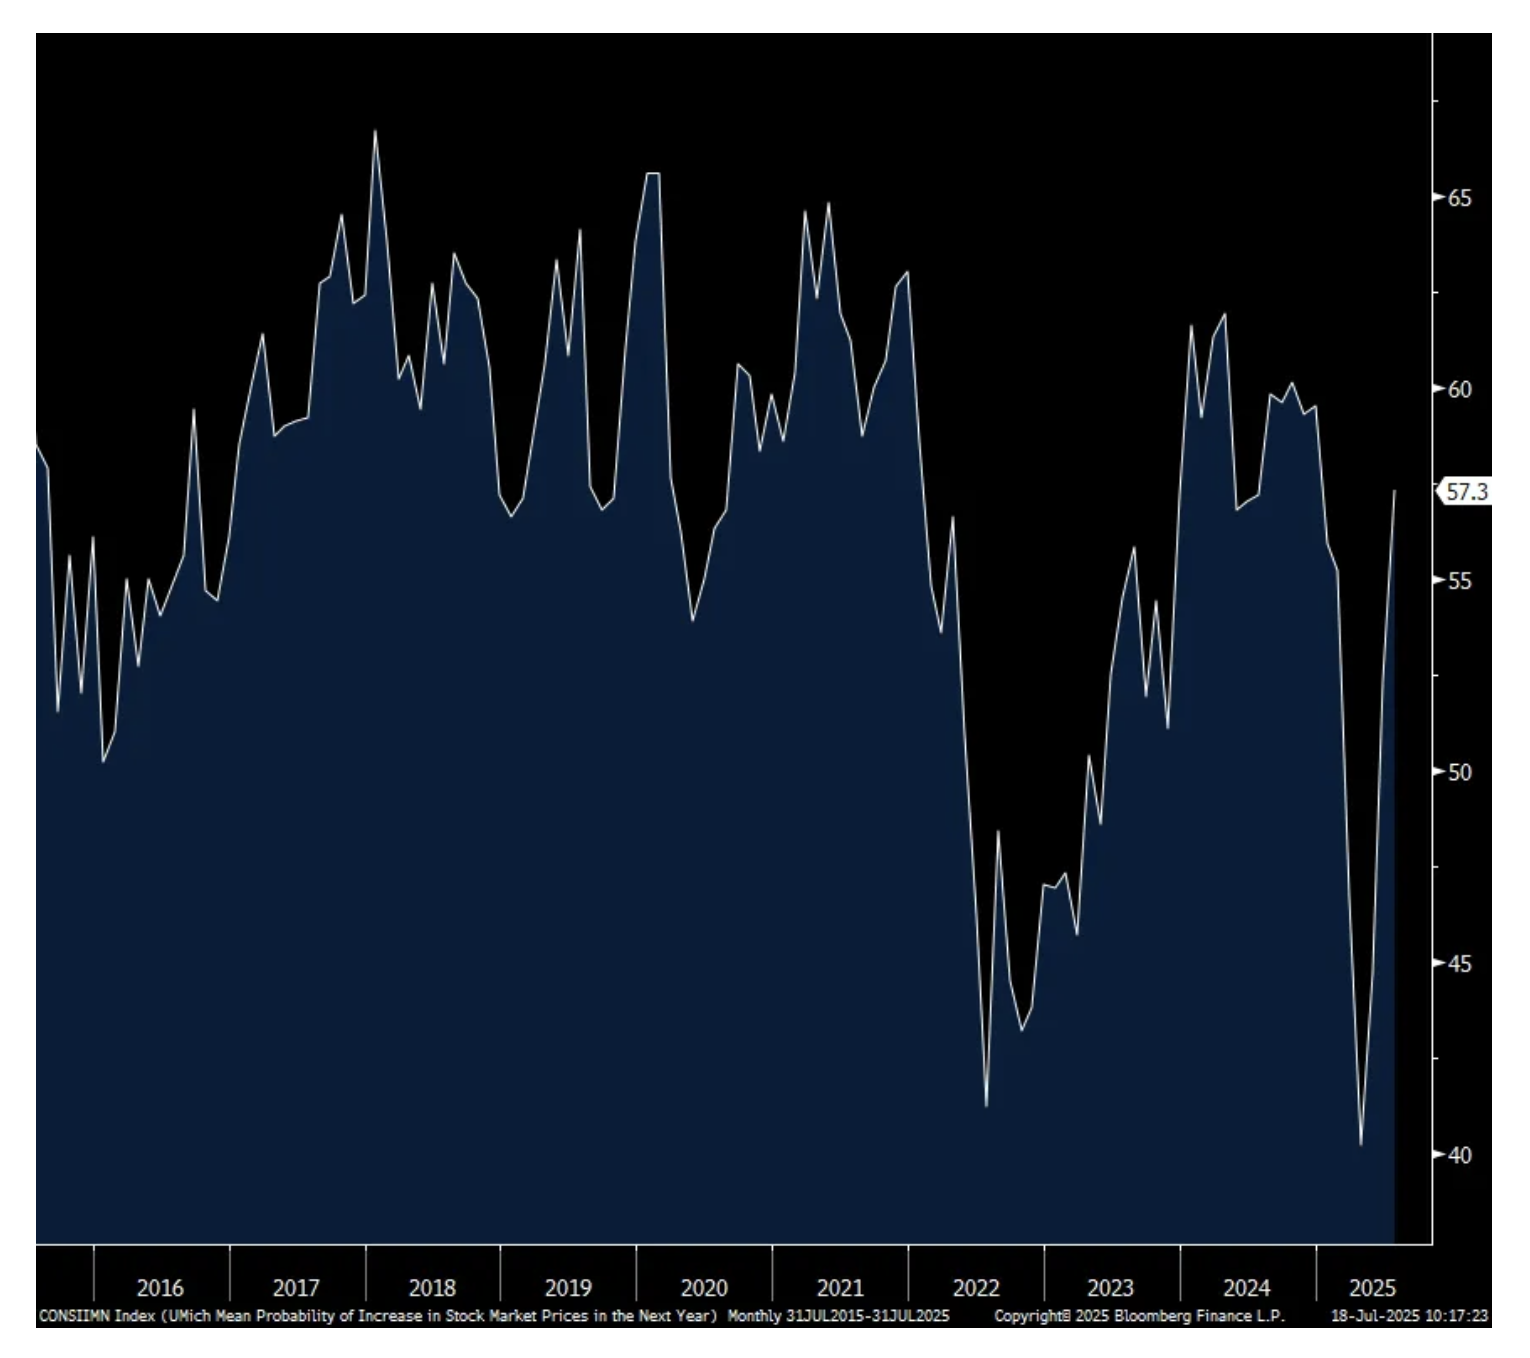
The preliminary July UoM consumer confidence index was up slightly, rising by 1.1 pts to 61.8 from 60.7 and about in line with the estimate of 61.5. While the best since February, we entered the year with this index at 74. For further reference, this index was at 101 in February 2020.
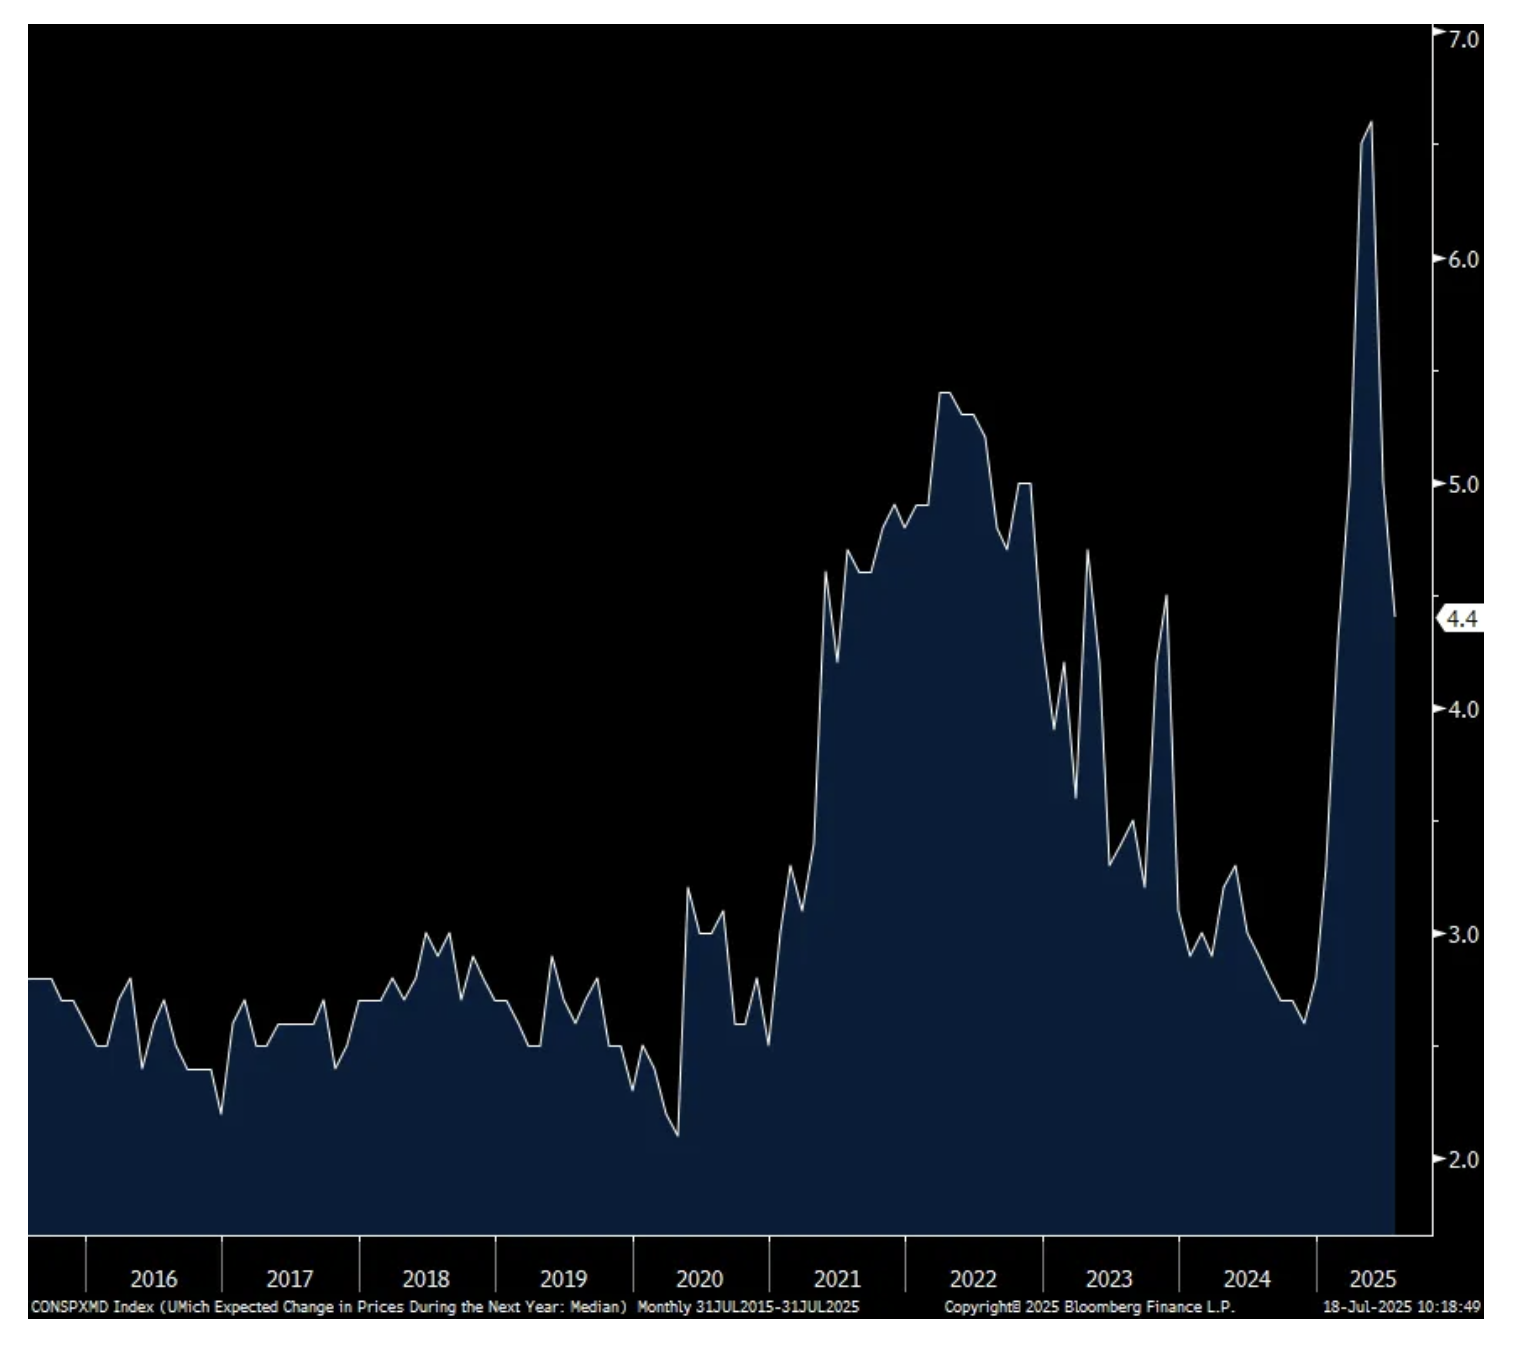
Current Conditions rose 2 pts m/o/m while the Expectations component was up by .5 pt. Positively, one year inflation expectations fell to 4.4% from 5%, though still up from 2.8% when we started the year. The 5-10 yr inflation guess was 3.6% from 4% in June and compares with 3.0% entering 2025. The UoM said because these two figures remain well above December 2024, “consumers still perceive substantial risk that inflation will increase in the future.”
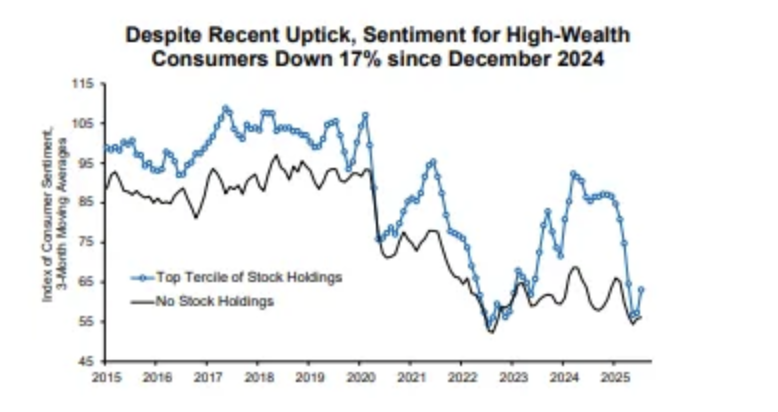
Helping confidence here too continues to be rising stock prices “with sentiment gains among stock market participants. However, those without stock wealth experienced a sentiment decline.” See the chart below that differentiates the mood of those who own stocks and those who don’t. Again, we know that upper income spending has been a major boost to the US economy and we’ve gotten much less help from those income cohorts below this. The UoM said, “for non-stockholders, sentiment is at virtually the same low level as last year.”
Of those surveyed, 57.3% expect higher stock prices in the coming 12 months vs 52.3% in the month before and that’s the highest since December 2024.
The employment component was little changed with those expecting ‘more’ jobs up 1 pt to 58, though was 65 in April. The income component remained negative at -1 and below zero for a 5th straight month.
With regards to spending intentions, there were one point gains for buying a home and major households while the expectations to buy a vehicle rose 4 pts.
Politics again were highly influential as confidence fell for Democrats, rose for Republicans and for Independents too.
The bottom line from the UoM, “Sentiment trends this year have been driven by the evolution of concerns over tariffs, primarily due to concerns that trade policy could worsen the prices consumers face. Moreover, consumers’ expectations over business conditions, labor markets, and even their own incomes continue to be weaker than a year ago. That said, the recent two month lift in sentiment suggests that consumers believe that the risk of the worst case scenarios they expected in April and May has eased, given the slowdown of trade policy developments thereafter.”
UoM
One yr Inflation Expectations
Those that expect higher stock prices in coming 12 months
BY Doug Kass · Jul 18, 2025, 12:50 PM EDT
BY Doug Kass · Jul 18, 2025, 12:15 PM EDT
With S&P cash +4 handles I am shorting more index calls.
BY Doug Kass · Jul 18, 2025, 12:05 PM EDT
The market's resilience continues — with any dip bought.
BY Doug Kass · Jul 18, 2025, 11:58 AM EDT
I covered my RSP short as I have better short opportunities elsewhere.
BY Doug Kass · Jul 18, 2025, 10:35 AM EDT
From Peter Boockvar:
Not to be outdone by Kevin Warsh's stated case for Fed Chair yesterday on CNBC, Governor Chris Waller repeated his desire last night to cut interest rates in a few weeks, and thus imply he still wants the job too. As likely they won't cut (rate cut offs are at just 6%), we assume Waller will be a dissent and maybe Michelle Bowman too. He said, "With inflation near target and the upside risks to inflation limited, we should not wait until the labor market deteriorates before we cut the policy rate. I believe it makes sense to cut the FOMC's policy rate by 25 bps two weeks from now."
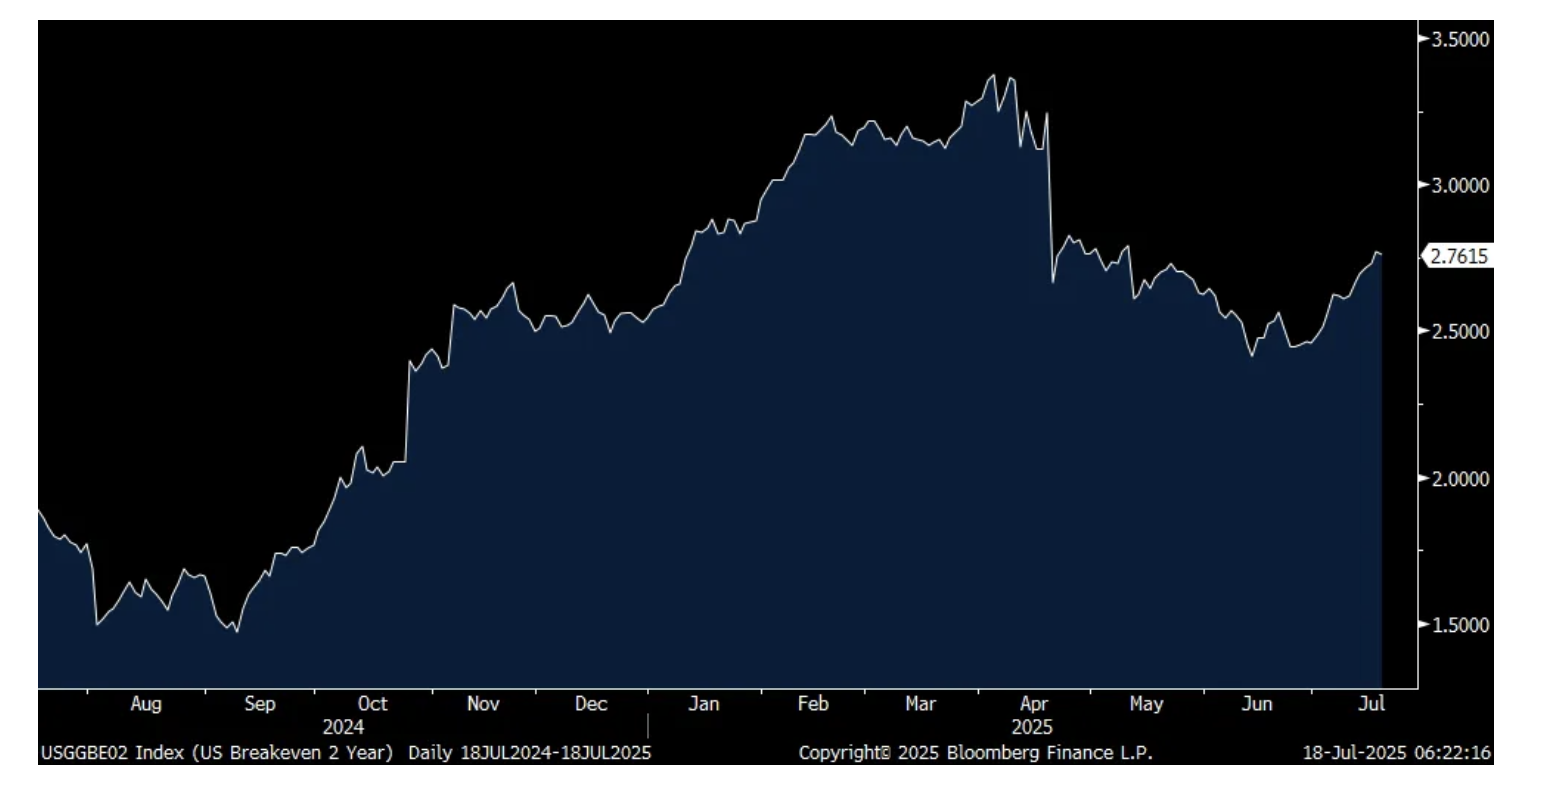
Digesting the week's inflation stats, inflation breakevens are up 6 days in a row thru yesterday's close. The 2 yr inflation breakeven is higher by 16 bps during this run. The 5 yr breakeven has gone from 2.40% to 2.54%.
2 yr Inflation Breakeven
After selling seen in April, foreigners stepped up their purchases of US Treasuries in May with most of the buying from the private sector which added $119.6b of buying while the 'official' side bought a net $27b. What was most interesting was the behavior of Canada. Canada sold $58b of US notes and bonds in April, the biggest one month amount on record but bought back $61.7b in May. I guess the tariff pause (though some tariffs are still on) made them feel better? China continues to reduce its holdings while there was little change in the amount Japan owns.
With an upper house election about to happen in Japan, understand that the main reason PM Ishiba has lost so much support is because the populace is pissed off about higher inflation as wage growth, while the best since 1991, continues to lag the rise in the cost of living. At the same time, the BoJ keeps talking about underlying inflation still not reaching its 2% level and thus continues to keep the overnight rate at just .5%, head scratching. The BoJ continues to not read the room and their desire for higher inflation was always going to be a 'be careful what you wish for' situation. This at the same time the government wants to continue with fiscal handouts to ease the cost of inflation that the BoJ has stoked. A continued bizarre situation.
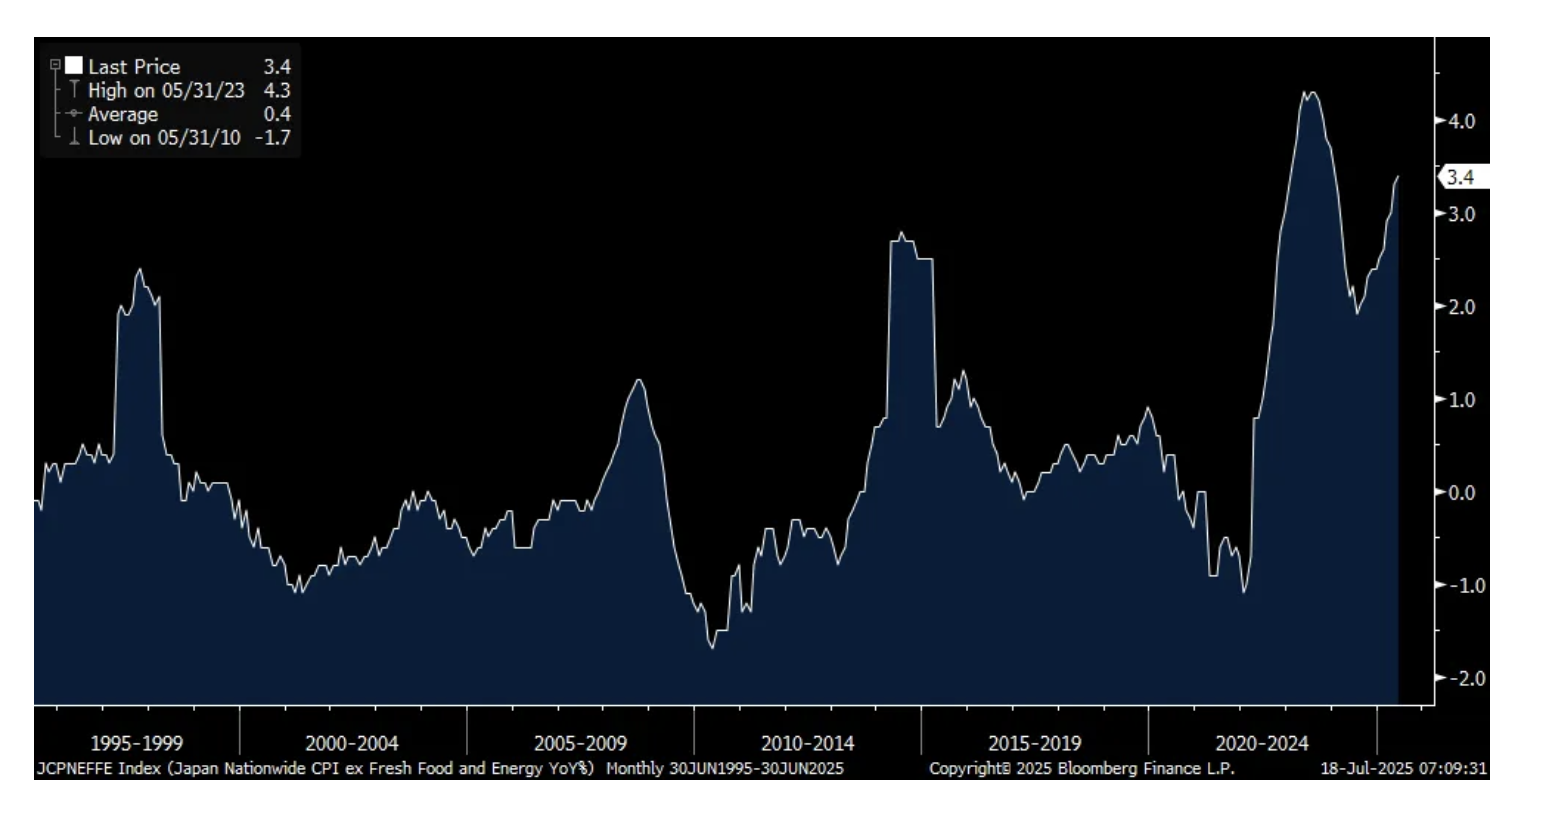
Japan's core/core inflation in June reported today rose 3.4% y/o/y, one tenth more than expected. Base pay growth has been up about 2%. This doesn't work for the Japanese citizenry. The reason why JGB yields fell as did inflation breakevens was because the headline rise of 3.3% was as anticipated and down from 3.5% in May. Cold comfort.
30 yr look at Japanese core/core CPI
A key conference call to listen to is Manpower with its staffing business around the world. This is what they said of note:
“When we last reported our Q1 results in April, we spoke at a time of heightened uncertainty, particularly surrounding trade negotiations and their potential impact on the global economy. At that point, many organizations were choosing to pause or slow hiring plans as they waited for greater clarity. Since then, we’ve seen some of this uncertainty being to ease. Employers facing not only macroeconomic complexity but also continued geopolitical tensions are proving resilient. What might once have been seen as black swan moments are now being absorbed with greater pragmatism and pace.”
“Our most recent Manpower Group Employment Outlook Survey of more than 40,000 employers across 42 countries also supports this view. The global hiring outlook is holding steady, up very slightly y/o/y and just one point lower than last quarter. The picture continues to be mixed globally though, with Latin America and Asia Pacific labor markets performing well. While we see cooling yet resilient hiring intent in North America. In Europe, employers continue to be more cautious, particularly in Northern Europe, reflecting its greater exposure to economic and geopolitical headwinds.” I bolded to highlight.
From Pepsi, a stock we own and most recently bought on the pullback:
"Our business remained resilient during the second quarter, navigating through a complex geopolitical and macroeconomic environment. Second quarter results featured a sequential acceleration in organic revenue growth - which included organic volume growth for our global snack foods - with our international business delivering 6% organic revenue growth and core operating margin expansion."
"In North America, despite subdued category demand, we were encouraged to see an improvement in organic volume trends for our convenient foods business as the quarter progressed - with an improvement in our market share in key subcategories as we stepped up commercial activities by offering good value to consumers, more focused innovation activity, and heightened in-market execution."
From Fifth Third Bank:
"In a quarter where uneven C&I loan demand and a soft housing market made loan growth tepid for the industry, our diversified loan origination platforms produced average loan growth of 5% over the prior year. We grew loans in C&I, CRE, leasing, mortgage, home equity, auto, and both our Provide and dividend fintech platforms."
But, "Economic uncertainty impacted client confidence and resulted in the lowest quarter of commercial loan production over the last year."
They also saw net charge-offs "at the bottom of our guidance range and improved over the prior year." And, NPAs (non-performing assets) dropped 11% sequentially led by a decline in commercial NPAs. Also, "Early stage delinquencies declined again and are near historical lows." On the flip side, "Our provision expense for the quarter included a $34 million build in our allowance for credit losses. This build was primarily attributable to the deterioration in the Moody's macroeconomic scenarios, which now project a .5% increase in their baseline unemployment rate projection, which is up to 4.7% by 2027."
"Broad based credit trends remain stable across industries and geographies, despite the market and economic volatility."
Here were the two main reasons for the y/o/y pick up in loan growth that they gave,
1)"when you talk to customers on the commercial side of the equation at the moment there is a general belief that as we continue to navigate the uncertainty around trade and the tariff levels, that there's a value to them in running with a little bit of extra inventory, and that supports utilization. We're not seeing the big buys that we saw in the first quarter that drove up utilization for us, but we do hear from clients that they, at the moment, are preferring to run on balance with a little bit more inventory than they otherwise would have carried just to compensate for any short term disruptions in supply chains."
2)"the bonus depreciation, the accelerated depreciation schedule on capital equipment, it is in some pockets in our customer base generating real interest and replacing equipment. It felt last year in the 2nd half of the year in particular like the US was underinvested a little bit of capital equipment purchases."
On the flip side, "The element that just hasn't come through, and that's reflected in middle market M&A activity everywhere, is the M&A driven demand. And, at some point there should be a little bit of a capitulation where either the sellers accept that with higher interest rates being maybe a more permanent phenomenon that they need to accede to buyer pricing expectations or you have buyers who have been patient and conclude that this is the time to go. That's really the third leg of the stool between the capital purchases, the inventories, and then eventually some M&A."
Snap On Tools makes tools and equipment that are used by car mechanics and said "we're encouraged by the results. Resilience and balance against an environment that's been quite turbulent. It's like one long mad minute where the commercial ground keeps shifting."
After highlighting the long term bull trend for auto repair like "miles driven, average vehicle age, household spend on repairs, tech talent and tech wages, they're all up" but "the macro environment is still turbulent." Though, "the tech uncertainty has stabilized. And having said that, it remains significant."
We're long a dirt cheap stock in the auto repair business, Monro that has gotten crushed, btw.
Burburry stock is popping today in London after better than feared numbers. Here is some of what they said:
"In Q1, we saw reduced activity by tourists globally and traffic remained challenged. That said, in Americas, we experienced 4% growth, supported by new local customer growth. EMEA grew 1% with local spend up mid-single digit percentage, which helped to offset the decline in tourist spend. Greater China was 5% lower in the quarter, with Mainland China down 4%. Globally, the Chinese customer group performed in line with the region. Asia-Pacific saw a 4% decline, driven by Japan, which declined by 10% following a slowdown in tourism. This was partially offset by South Korea as the region returned to growth, up 2%."
BY Doug Kass · Jul 18, 2025, 9:55 AM EDT
On the opening push higher (S&P cash +14 handles) I added to August SPY/QQQ puts and September short SPY/QQQ calls.
BY Doug Kass · Jul 18, 2025, 9:42 AM EDT
I thought the markets misinterpreted (the shares initially rose by +$4) American Express' AXP results - as travel expenditures slowed down significantly (deep in the footnotes). Q2 2025 Earnings Press Release
But, arguably, this is a market governed by animal spirits, price momentum and Kids (Today) - and not deep analytical dives.
I sold out my AXP long earlier in the week, as posted.
BY Doug Kass · Jul 18, 2025, 9:30 AM EDT
BY Doug Kass · Jul 18, 2025, 9:20 AM EDT
BY Doug Kass · Jul 18, 2025, 9:10 AM EDT
-MEIP +128% (files $100M Private Placement of 29.2M shares/warrants at $3.42/shr to Initiate Litecoin Treasury Strategy)
-BZAI +88% (secures contract to deploy hybrid AI platform)
-TLN +17% (acquiring two gas plants for $3.5B)
-EOSE +14% (BlackRock discloses 7% stake)
-HES +7.5% (CVS successful in arbitration case against Exxon over Guyana oil assets; clears way for Hess Chevron deal to go forward)
-ATUS +5.3% (entered into $1B asset back loan facility)
-IBKR +4.8% (earnings)
-NSC +4.3% (strength from potential deal with Union Pacific)
-MMM +3.5% (earnings, guidance)
-RF +3.4% (earnings, guidance)
-SRPT -23% (FDA said to probe liver failure death in SRP-9004 trial)
-BKSY -21% (reports prelim Q2 below expectations; files to sell $160M convertible note offering)
-VTRS -4.0% (Phase 3 trial for blepharitis drug MR-139 fails to meet endpoint)
-BLBX -3.5% (provides shareholder update following acquisition of rare earth company)
-SIFY -3.3% (earnings)
-NFLX -2.5% (earnings, guidance)
BY Doug Kass · Jul 18, 2025, 9:00 AM EDT
JPMorgan on Netflix NFLX:
· Looks fine first glance, but not blow out… Q2 maybe a touch light of bars, and the upside to 2025 profitability guide (OPM & FCF) is a little underwhelming. This is just semantics here though, the story is fine (especially revenue trends where the guide increase is in line with buyside bars), and I don’t think anyone is selling on this.· Key debates ahead of the call @ 445aET… 1) advertising trends - any change to 2025e outlook (revenue double y/y), early thoughts on 2026, and ad tech momentum (1P roll out + Yahoo deal), 2) pricing and impacts from recent price increases relative to prior guidance, 3) content thoughts (bumper H2 slate, sports thoughts, future spend, etc), 4) recent TF1 deal on TV broadcast.· Q2: Revenue $11.08b (+17% FXN) vs guide $11.04b (buyside $11.1b+), OPM 34.1% vs guide ~33.3%, and FCF $b vs St $2.11b.· Q3 Guide: Revenue $11.53b (+17.3% y/y FXN) vs buyside looking for ~$11.4B (St $11.3B), OPM 31.5% vs St 30.8%.· 2025 Guide: Raising revenue guidance to $48.8-45.2b (prev $43.5-44.5b, buyside ~$45b midpoint); OPM raised to 30% reported (prev 29%); FCF guide raised to $8.0-8.5b (prev $8b)
BY Doug Kass · Jul 18, 2025, 8:45 AM EDT
From JPMorgan:
US: Futs are flat. Headlines after yesterday’s close were mostly muted: NFLX had a solid report, but market reactions were muted amid high expectations. Waller called for a 25bp cut at the July meeting. Pre-market, MegaCap Tech sees NVDA up modestly (+0.4%), followed by AAPL and GOOGL; Consumer Staples and Financials are outperforming. Yields are lower and USD is weaker; 2-, 5-, 10-, and 30-year yields are down by 1-2bps. Commodities are mixed, with Oil and Precious Metals higher, while Base Metals are flat.
and...
VIEWS ON YESTERDAY’S MACRO DATA (we sent below immediately after the release) –
The 8:30AM ET data today all point to the Goldilocks narrative: robust retail sales, dovish import prices, lower-than-expected weekly jobless claims and a strong print on Philly Fed business outlook. Today’s data supported the resilient macro in June, in line with what we saw in CPI/PPI and NFP. The beginning of Q2 earnings, particularly in airlines and banks, show corporates continue to see solid growth as we have already past the peak macro/policy uncertainty. Our consumer cash pile analysis shows that 4 out of 5 quintile of US consumers have more cash than 2019 even when adjusting for inflation. With aggregate consumer still having cash to spend, we continue to see this support US consumers and macro growth.
· FROM OUT CONSUMER CASH PILE ANALYSIS (Let us know if you would like a copy of the note): When analyzed by income bracket, we separate into 6 brackets: Top 1% percentile, 80th – 99th percentile, 60th – 80th percentile, 40th – 60th percentile, 20th – 40% percentile, and bottom 20th percentile. We find that all of those income brackets except for the Bottom 20th percentile have more cash than 2019 even when adjusting for inflation, ranging from 6% to 21% more cash.
· JPM ECON (ABIEL REINHART) – Abiel sees real consumer spending to be flat on the month, which leave 2Q real spending at 1.2% q/q saar, below the team’s prior forecast of 1.5%.
o In June, both headline and control retail sales turned in their best performance since March, with headline rising 0.6% and control up 0.5%. However, considering that headline PCE inflation is projected to have risen 0.3% on the month and the services trend has been soft recently, real consumer spending likely was flat on the month. When factoring in downward revisions to past months, that would leave 2Q real spending at 1.2%q/q saar, or 1.3% if services were to pick up a bit, though in either case it’s slightly lower than our prior forecast of 1.5%. We are currently forecasting a 0.5% gain in 3Q, which with the current trajectory would imply average real spending gains of 0.1%m/m, slower than the average over the past year (0.2%m/m), though a bit quicker than the pace over the prior six months.
o Sales across almost all store types rose on the month. Motor vehicle and parts dealer sales were up 1.2% despite both new unit sales (-1.7%) and CPI vehicle and parts (-0.4%) falling. Food services rose 0.6%m/m, resuming a steady uptrend. Building material store sales rose 0.9%, though that does little to reverse a recent pullback. Within the control group, which excludes motor vehicles, gas stations, building material stores, and food services, the largest contributions came from nonstore retailers (0.4%), general merchandise (0.5%), food and beverage stores (0.5%), and miscellaneous retailers (1.8%). Nominal sales at furnishing, electronics, and appliance stores fell 0.1%m/m and are down 2.0% saar over three months despite rising prices, with tariffs having already lifted prices for some of the goods sold at these stores.
o If our forecast for real consumer spending is achieved, then quarterly growth in the first two quarters of the year would have averaged about 1% annualized after excluding some distortions from political spending in nonprofits. Excluding COVID that would be the worst two-quarter consumer spending pace in over a decade, emphasizing just how much the consumer has slowed purchase activity despite some renewed front-loading of vehicle purchases earlier in the year and not much acceleration in overall inflation.
BY Doug Kass · Jul 18, 2025, 8:23 AM EDT
I found it remarkable that at about 5 AM this morning a Bloomberg reporter who, based on her posted resume has never managed money professionally, said:
"Mag 7 stocks are up seven days in a row, it looks like Mag 7 is a "sure thing."
That about sums up the current market state — everyone, it seems, is a "first-level thinker" who worships at the altar of price.
In this week's market update, "Stock Market's Downside Risk Is Approximately 4x Upside Reward," I went through the bullish case and responded to it.
This morning I went back in history to revisit previous bouts of speculation (and man's investment hijinks).
I want to post a relevant editorial I wrote for Barron's Magazine (it was one of five I have written over the years) for a possible behavioral lesson that today's traders and investors might learn from:
Voltaire said that “History never repeats itself. Man always does.”
And I am blinded by a sense of history.
BY Doug Kass · Jul 18, 2025, 7:45 AM EDT
BY Doug Kass · Jul 18, 2025, 6:45 AM EDT
For "kicks and giggles" my office compiled several of my questions to Charlie Munger and Warren Buffett at Berkshire Hathaway's 2013 Annual Meeting in Omaha, Nebraska.
I hope you enjoy this memory.
Let's go to the tape!
BY Doug Kass · Jul 18, 2025, 6:30 AM EDT
BY Doug Kass · Jul 18, 2025, 6:10 AM EDT
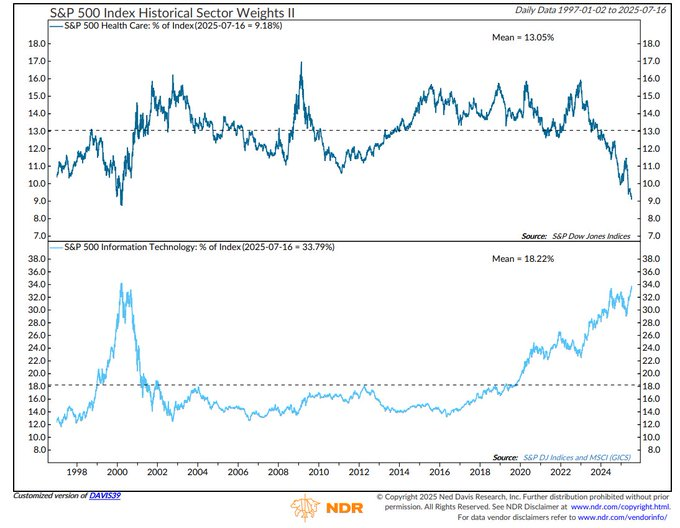
The Health Care weight in the S&P is currently the most extreme oversold since March 2000 (technology is the opposite!):
BY Doug Kass · Jul 18, 2025, 5:55 AM EDT
The S&P Short Range Oscillator dipped to 1.57% vs. 1.97% — meaning we are in a less overbought.
BY Doug Kass · Jul 18, 2025, 5:45 AM EDT