Daily Diary

D
Doug Kass
DATE:

You're reading 0 of 1 free page.

Register to read more or Unlock Pro — 50% Off Ends Soon

Not logged in? Click here to log in

Hot Dog!

Since everyone is being gluttonous and playing the bull and the momentum these days, I will play the "chalk" in tomorrow's Nathan's Famous Hot Dog Eating contest in Coney Island. 

My pick is Joey Chestnut, who has has been off for a year (sanctioned by Nathan's for sponsoring a competitor!).

https://www.twitter.com/joeyjaws/status/1934612017052336469

Our channel checks indicate that Joey is eyeing previous record (of 76 hot dogs) achieved in 2021. (Shhh!)

So I will further make the ludacris forecast that Joey establishes a new hot dog-eating record of 77 hot dogs on Friday.

Note: I remain short Coca-Cola KO, which is the beverage of choice in the Hot Dog Eating contest on July 4. 

BY Doug Kass · Jul 3, 2025, 12:35 PM EDT

Nothing Since

I made no additional trades since the last report.

BY Doug Kass · Jul 3, 2025, 12:18 PM EDT

Fed Speak

Fed's Bostic says momentum is stalling but it's too early to say that a downturn is probable.

* Expect elevated inflation for longer period, but no spikes.

* Businesses delaying hiring and investments; Expect demand to stagnate or decline if costs continue rising.

* Recent sanguine inflation readings a result of businesses delaying price increases to get clarity on final tariff levels.

BY Doug Kass · Jul 3, 2025, 11:12 AM EDT

Entering Fantasy Land

To follow up on my Rosie update.

Of the 74,000 private sector jobs, 51,000 came from education/health category -- there was almost no job growth elsewhere.

The labor force keeps shrinking with participation rate down again.

The work week fell, too.

ADP said jobs fell and we are celebrating a trade deal with Vietnam where tariffs will be +30%?


Why are we putting tariffs on sneakers and t shirts of 30%? Such a deal!

The market is now in complete fantasyland, with performance chase/panic with little in the way of fundamental underpinnings.

BY Doug Kass · Jul 3, 2025, 10:56 AM EDT

Rosie Does a Deeper Dive Than Most on This Morning's Jobs Report

We are at the stage of the market advance when there is absolutely no skepticism and, at times, no analysis.

There are no deep dives - sometimes not even a dive at all!

From Rosie:

So, let’s get this straight. We have a report here that has caused market-based odds of a July Fed rate cut to move to 0% and for September down to 80% from 100% prior to the data release. Yet, look at what the data imply. A decline in both nominal and real work-based incomes in June, and with factory payrolls down -7k for the second month running alongside a flat manufacturing workweek and overtime hours, another month of negative industrial production growth.

The initial market reaction only tells me that investors and traders have yet to conduct any real analysis on this report because it was far weaker than the headline suggested. Hopefully the economics staff at the Fed will be combing through the report and advising FOMC officials as such — though I must admit that former Vice-Chair Ferguson’s synopsis on CNBC this morning and his view that all that matters is the headline and the jobless rate on its own is a big concern, if that is how monetary policymakers do their homework.

Rosie points out that the jobs number was weak and the headline should be faded:

There is a big danger in drawing conclusions from the headlines. Scratch the surface, and you will see the cracks surfacing in the U.S. labor market. It isn’t altogether that difficult a task.

I realize that the headline payroll number topped consensus views, and I have a Bloomberg terminal, so I also know the initial market reaction. And the pop in bond yields in particular is completely misplaced in my view. This was NOT a strong report — not by a country mile. Yes, nonfarm payrolls again surprised to the high side, coming in at +147k in June (consensus was for a +106k print), but private sector employment came in very light at just +74k (consensus here was at +100k) in the softest gain in eight months (May was also revised down a touch to +137k from +140k).

But it gets even better. The seasonally adjusted Birth-Death model added +76k jobs, which is pure fantasy since we know that business bankruptcies have climbed to near cycle highs and new business creation has slowed to a crawl. When you strip out this skew, private sector jobs actually declined fractionally — that is the major takeaway in this report. This emboldens, not detracts, from the recession call. Virtually all of the headline job gain came from two sectors that have nothing to do with the economic cycle — state/local government and heath/education/social services. The other two-thirds of the labor market basically stagnated.

As I said in Early Morning with Dave, the QCEW data have already revealed that the Birth-Death model has been distorting the monthly payroll data by nearly +70k monthly on average. That adds credence to the view that the underlying private sector employment number was flat last month. Then tack on the fact that the private sector workweek shrank by -0.3% MoM to 34.2 hours and that means that the index of aggregate hours worked fell -0.26% sequentially, which is something we last saw happen eleven months ago — and what that means is that the jobs-equivalent change in June was -280k!!

There was an obvious focus on the unemployment rate, and instead of inching higher to 4.3% from 4.2%, it dipped to 4.1%. But at the very same time, the average hourly wage number came in light at +0.2% MoM (the consensus was at +0.3%) and that helped take the YoY trend down a tick to +3.7% from +3.8% (consensus was +3.8%). It does beg the question as to just how tight the labor market is if wage growth is decelerating as opposed to accelerating. Then again, if not for the drop in the participation rate, the headline unemployment rate actually would have ticked up as expected to 4.3%.

What is holding down wage rates is the growing ranks of the unemployed still engaged in their job search and growing desperate: the median duration of unemployment rose to 10.1 weeks from 9.5 weeks in May; the mean increased to 23.0 weeks from 21.8 weeks. The share of the unemployed who have been looking for work for more than 26 weeks expanded from 20.4% to 23.3%, the second highest level over the past three years.

When you tack on the decline in hours worked, average weekly earnings — the proxy for work-based personal income — slipped -0.1% MoM. This is what classifies on bubblevision as a strong report? Give me a giant break.

Meanwhile, the Household Survey showed +93k for the headline job gain, which seems far closer to reality (as did the ADP) — not influenced by the faulty Birth-Death model. This barely put a dent in the -696k May plunge, and leaves employment in this survey down at a -0.8% annual rate since the turn of the year. As an aside, even that +93k print from the Household Survey was flattered by the fact that multiple job holders, a classic contra-cyclical indicator, soared +202k last month. The reason why the jobless rate fell was that the labor force contracted by -130k, and this was all due to a seasonal early summertime quirk via a -237k slide in 16- to 24-year-olds. The labor supply in the critical adult working-age population (25-54) actually jumped +194k last month.

BY Doug Kass · Jul 3, 2025, 10:40 AM EDT

From The Street of Dreams

From JP Morgan:

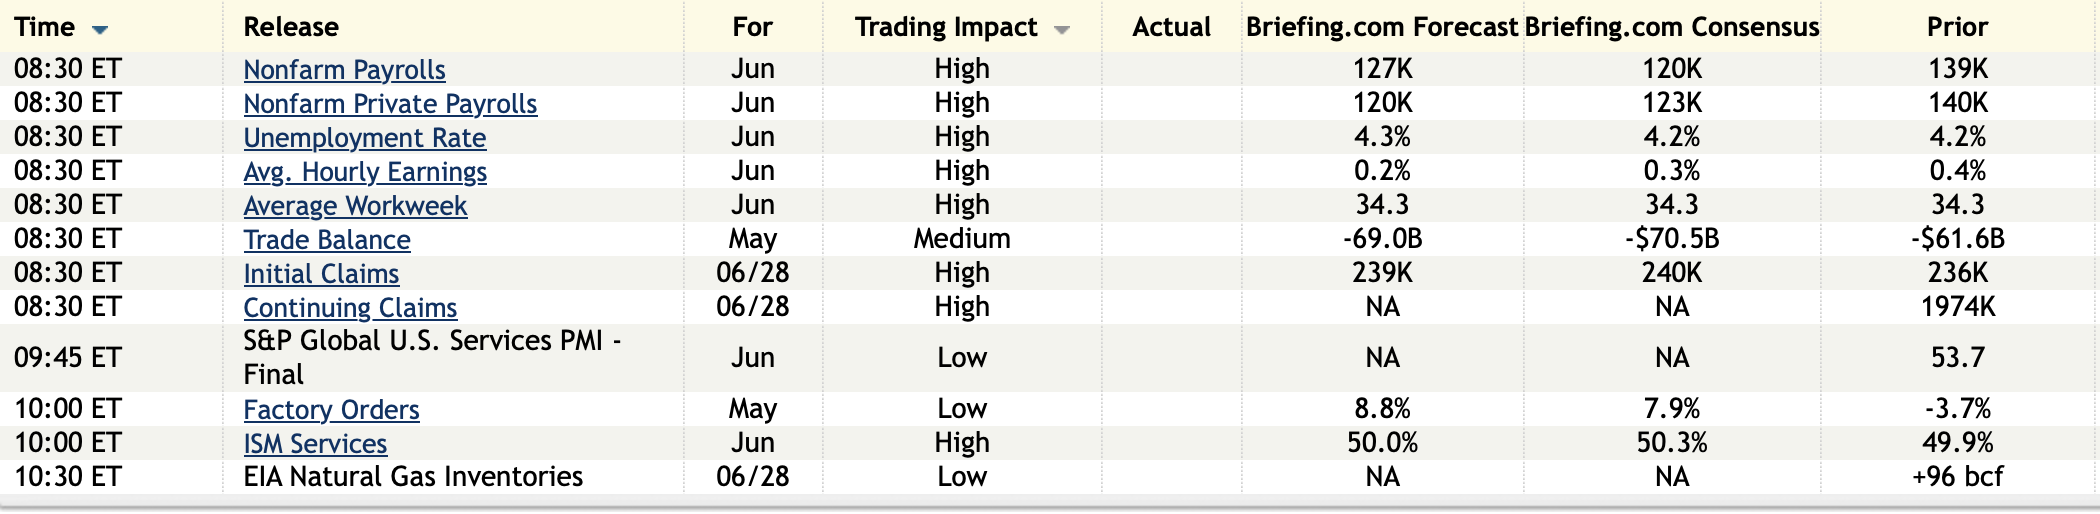
US: Futs are flat with RTY outperforming into NFP. Siemens says that the US has dropped its restrictions on software, used to design semis, exports to China, CDNS/SNPS are both up more than 6%. Pre-mkt, bond yields are lower reflecting heighten downside risk to NFP today; BBG consensus is 106k jobs with BBG whisper number of 96k. USD is flat with cmdtys higher led by ags, base/precious, and natgas. The tax/budget bill appears likely to pass later this morning so keep an eye on yields though any impact may be delayed until next week given the holiday.

and...

Prime Time / Monthly Wrap | Positive Momentum Continued in June Though Potential Rotations Remain in Focus

SUMMARY: June was another solid month for global equities with US TMT and Korea leading the way. Some of the trends last month broadly continued, such as positive HF performance (+2.4% MTD globally), high gross leverage (97th %-tile over past 5yrs), increased net leverage (+3% MoM and 77th %-tile over past 5yrs), continued rally (and higher risk) in Momentum globally, and further normalization in EU vs. US flows/positioning.

The first day of July brought with it a big sell-off in Momentum and there’s a sense that equity performance could broaden out in the US if macro data remains benign and the Fed were to pivot more dovishly. As we think about some of the key themes from June and what could be in focus going forward, here are a few things we’re focused on:

1. Will the Momentum unwind persist? On Tuesday, we saw modest de-grossing by HFs in aggregate, but the overall magnitude wasn’t that extreme (-0.4z gross flows globally, though almost -2z for Quants in N. Am.). Notably, the decline in Momentum has been global, but started in AxJ last week. In addition, there was also a drop in performance of HF crowded stocks, but the decline was greater on the long side than were gains on the short side.

Ultimately, whether the drop in Momentum persists could depend on a) macro data and whether Fed expectations shift, b) tariffs / trade deals, and c) earnings.

To us, the potential for further de-grossing remains high from a flows/positioning standpoint as: a) gross leverage and flows remain high, b) Momentum net risk is at multi-year highs for Quants and L/S funds, c) Equity L/S funds’ long leverage is at the highest since late 2021, d) Quants have seen choppy performance lately in the US, e) some sectors/themes continue to have relatively wide positioning divergences.

Additionally, EU Momentum positioning remains stretched among HFs with net exposure >90th %-tile, though flows started turning negative in late June.

2. How will US Tech vs. Russell perform going forward, given differential in positioning? On the Tech side, combined flows to Info Tech turned negative in June (despite index outperformance) and HFs started to sell AI TMT (JPAITMT) stocks into the late June rally (something they did earlier this year and last June), which could suggest less confidence in near-term upside.

However, there are still risks in terms of Tech positioning. HF positioning in US Semis remains very close to 10yr highs. ETF positioning shows Info Tech’s weight in absolute and relative terms (vs. SPX) at highs. CTA positioning in NDX vs. RTY was back at mid-Feb ’25 and early Jul ’24 levels.

On the small cap side, positioning and flows generally remain light. In futures, AM positioning is at neutral levels. ETF flows to small caps have been at lows for the past few months. Eq L/S net exposure to Size factor has gone up as SPX has outperformed RTY since late ’24.

3. Do HFs eventually cover shorts in a big way? So far, the drivers of US High SI stocks over the past couple months seem to be related to factors (our measure of Risky factors’ 3m returns are back at highs), rather than HF specific behavior as the Short Interest factor hasn’t seen nearly as big an increase as we’ve seen during other large short-cover periods. Thus, if the market keeps rallying and gains broaden out, it’s possible that we could see this dynamic shift a bit further. Retail flows have also been relatively limited, but could drive increases if they accelerate again.

4. Could Banks / Financials keep rallying? Among HFs, one of the most net bought groups in the US lately have been Banks. However, the group could keep outperforming, especially if we see ETF flows pick back up as Financials ETF positioning remains very low. On the European side, Banks remain one of the more favored trades and saw small buying among HFs last month (HF net exposure at the 85th %-tile since 2018, though not as high as Cap Goods).

5. Industrials (esp. Cap Goods) a sector to watch globally? In Europe, Cap Goods remains the most net long group (+3z and 98th %-tile since 2018), though overall net flows last month were neutral. Within the group, EU Defence was sold again in late June by HFs as they seemed to take profits. The profit taking has reduced risk levels a bit, but the overall positioning remains elevated. In the US, we’re seeing ETF inflows return to Industrials, while HFs further bought Cap Goods, putting net exposure at 12m highs, but only 70th %-tile since ’18. In AxJ, Cap Goods is the most net long group (98th %-tile since ’18) and in Japan, Cap Goods was bought for the past 2 months and positioning is relatively high as well (82nd %-tile).

6. Can Japan break higher? CTA positioning in Japan recovered further to 72nd %-tile (though still below HK at 98th %-tile). From a sector standpoint, key groups like Semis, Banks, and Autos have seen HF net buying from the lows, but positioning remains relatively neutral.

7. Will AxJ selling reverse? Despite the continued rebound in AxJ, HF net flows remained negative in June. Notably, some of the large selling over the past few weeks has come in Korea with longs sold into the sharp rally. Over the past few years, HF flows & positioning have generally been positively correlated to performance, so the recent divergence is quite large (though we saw something similar around the middle of last year).

VIEWS ON ADP YESTERDAY

· US MKT INTEL (we sent below immediately after the release to some IB chats): Post pandemic, this is the second time where ADP prints a negative number (the last time was March 2023). The decline in ADP employment was primary driven by Services (Financial activities, professional/business services and Education/Health services), while Leisure and hospitality remain robust (which is in line with the JOLTS report yesterday). While this is clearly a negative signal on labor market, two things may worth considering on the impacts: (i) ADP’s Chief Economists mentioned that layoffs continue to be rare and the decline was more driven by hesitancy to hire; (ii) Overall, ADP is not a reliable predictor of NFP. From ADP Chief Economist: “Job losses in professional and business services, and education and health services led the decline. Leisure and hospitality, and manufacturing showed gains…Though layoffs continue to be rare, a hesitancy to hire and a reluctance to replace departing workers led to job losses last month. Still, the slowdown in hiring has yet to disrupt pay growth.”

BY Doug Kass · Jul 3, 2025, 9:45 AM EDT

Subscriber Comment of the Day

keithfern

1 minute ago

Dougie - your comment about 6 rate cuts now being 2 rate cuts and yet we continue higher is a perfect example of economic data no longer driving equities. Machines don't care. and more importantly - the humans behind the machines don't care. If buying is the path to making money each day - then buying will happen. Kinda like venture capitalists - no one wants to invest in a company until 1 VC gets interested - then everyone is interested. And then your point about a violent downward move without a catalyst will occur.

BY Doug Kass · Jul 3, 2025, 9:21 AM EDT

Upside, Downside Market Movers in the Morning

Upside:

-THTX +33% (enters into Definitive Agreement to be Acquired by CB Biotechnology at $3.01/share in cash, plus one contingent value right for potential additional aggregate payments of up to US$1.19 per share)

-XPOF +21% (SEC informed the Company that it had concluded its 18 month investigation without action)

-DDOG +10% (to replace JNPR in S&P 500 Index, effective July 9th)

-TRIP +8.7% (reportedly Starboard has built a stake of more than 9%)

-ECX +8.6% (releases white paper showing >50% reduction in integration time for Google's world-leading GAS automotive application suite)

-CDNS +5.0% (confirms BIS informed Cadence that license requirements set forth in May 23, 2025 letter from BIS were rescinded effective immediately)

-SNPS +4.8% (lifting of recent U.S. export restrictions for chip-design related to China)

-ANSS +4.2% (lifting of recent U.S. export restrictions for chip-design related to China)

Downside:

-FC -10% (earnings, guidance)

-RCT -8.9% (prices 9.0M shares at $1.50/shr in $13.5M private placement)

-GURE -2.8% (files $10M mixed shelf)

-HOOD -2.8% (not selected to replace JNPR in S&P 500 Index)

-ASML -2.0% (Samsung delaying chip plant completion)

BY Doug Kass · Jul 3, 2025, 9:15 AM EDT

Charting the ETF Action in the A.M.

Charts from 8:14 a.m. ET:

BY Doug Kass · Jul 3, 2025, 9:05 AM EDT

Premarket Movers

Chart from 8:34 a.m. ET:

BY Doug Kass · Jul 3, 2025, 8:55 AM EDT

Shorting Indexes After Jobs Report

Shorting the indexes into the ramp after the weak jobs number:

SPY $622.13

QQQ $532.77

BY Doug Kass · Jul 3, 2025, 8:48 AM EDT

Today's Economic Calendar

BY Doug Kass · Jul 3, 2025, 8:35 AM EDT

My Tweet of the Day (Part Deux)

https://www.twitter.com/DougKass/status/1940746189671977040

BY Doug Kass · Jul 3, 2025, 8:22 AM EDT

Some Overboughts and Sentiment Extremes

The S&P Short Range Oscillator (which was way OVERSOLD at -8.00% in early April 2025) climbed dramatically at yesterday's close (to 7.38%) and is now way OVERBOUGHT.

From The Divine Ms M's "What Does it Take to Get a Bull to Jump a Fence? A Rally." this morning: 

The [Investors Intelligence] bulls jumped up to 51%. On its own, there is nothing special about 51% (upper 50s to 60s is extreme), but when the Bulls jump by 12 points, I take notice. And I do so because in the last 30+ years, they have only jumped by ten points or more two other times. What’s more, those other two times the jump came mere weeks (2-3) from the low. This time, it took nearly three months for the jump to occur.

Sure, the Bulls haven’t been this high since January, but they were over 60% in December. So by the time January rolled around, they were already coming down.

Naturally, I went back and looked at the two other times this occurred. And yes, let’s remember this is a small sample size. October 2002 was the end of a long bear market, as we were nearly three years into the bear at that point. Notice it occurred about two weeks after the low, and most of the rally was already done. We crept a bit higher and went sideways for two months before coming right back down again.

In October 2014, we see that it took about three weeks from the low before they jumped the fence, and this time they did so after making a higher high (similar to now). But here too we crept upwards and about a month later gave it all back, then we mostly went sideways before heading up and going sideways again.

In neither case did the market just blast higher. Maybe this time will be different, but the Daily Sentiment Indicator (DSI) is now at 83 for the S&P, so that runway is feeling a bit short, especially if the market rallies on the Employment number Thursday.

There was one other sentiment shift on Wednesday: the ISE equity call/put ratio was 2.72 which was the highest reading since March 17th. There were some higher readings in February, but recall just three days ago, I noted how the equity put/call ratio (CBOE) had not tumbled under .50 in quite some time. The ISE equity ratio has now shifted. So, sentiment has clearly jumped the fence in some of these indicators. None are extreme, but they are pushing on extreme.

BY Doug Kass · Jul 3, 2025, 7:38 AM EDT

Listing My Long and Short Holdings

In the interest of transparency (and having a holding list in one convenient location!), here is a partial list of my long and short holdings in my hedge fund, Seabreeze Partners.

This list is not all inclusive and excludes holdings that (for one reason or another) I have not made public in my Diary:

Longs: METAAMZNTOLPHMJOEGRBXKBHBACCWFCJPMMSGSAXPKKRAPOBXFGENVVV, TSNDF, GTBIFTCNNFCURLFGLASFVRNOF, Ligado Bonds

Shorts: SCHWFXLVRILYMPWDNUTKOWMTWBDWGOBXMTSNBRCHGGFIGSWOOFFRHCTEMMSTRAYRWFARKKBITOIBITBITBJOET, GRNY, SPY (Common and Calls), QQQ (Common and Calls)

All Individual Equity Holdings (long and short) are either (S) or (VS)

Long SPY puts (VS), QQQ puts (VS)

Short GRNY (L), JOET (S), SPY Common (M) and Calls (S), QQQ Common (M) and Calls (S)

BY Doug Kass · Jul 3, 2025, 7:00 AM EDT

Thursday Premarket Trading

* Added to SPY $621.12 and QQQ $551.69 shorts.

* Took new trading short rentals (with tight stops) in PLTR $132.86, NVDA $156.77 and HOOD $96.20.

BY Doug Kass · Jul 3, 2025, 6:41 AM EDT

Charting the Technicals

https://www.twitter.com/MikeZaccardi/status/1940501494052307175
https://www.twitter.com/RyanDetrick/status/1940515900115112053
https://www.twitter.com/mattcerminaro/status/1940464292979237256
https://www.twitter.com/LouisSpectorCMT/status/1940541644987945283
https://www.twitter.com/AlfCharts/status/1940399307305398613
https://www.twitter.com/sam_gatlin/status/1940419383479992695
https://www.twitter.com/sstrazza/status/1940446311347864038
https://www.twitter.com/JasonP138/status/1940410373691293955

Bonus — Here are some great links:

Trend Just Flipped, Don't Fade It

Fifty Stocks to Look At

Big Banks Gaining

Buying the Three Bs

BY Doug Kass · Jul 3, 2025, 6:20 AM EDT

My Tweet of the Day

https://www.twitter.com/DougKass/status/1940126468270694463

BY Doug Kass · Jul 3, 2025, 5:55 AM EDT

Chart of the Day

https://www.twitter.com/Barchart/status/1940565812563399028

BY Doug Kass · Jul 3, 2025, 5:45 AM EDT